Data + Graphs
Réviser ces flashcardsGratuit · répétition espacée · iPhone, Android, Mac et web
Toutes les cartes
1
Define statistical inference
Making predictions about population on basis of sample data
More concerned about what sample can tell us about the population rather than the sample itself
More concerned about what sample can tell us about the population rather than the sample itself
2
State the 3 different measurement scales
Nominal
Ordinal
Quantity
Ordinal
Quantity
3
Define nominal
No specific order
Categories
Categories
4
Define ordinal
Has meaningful order
Ranked or ordered in some way
Ranked or ordered in some way
5
Define quantity
Values that can be discrete or continuous
6
Define descriptive statisics
Single values that describe the central tendency, variation and shape of the distribution
Central tendency:
- Mean
- Median
- Mode
Variation:
- Standard deviation
- Range
- Variance
Central tendency:
- Mean
- Median
- Mode
Variation:
- Standard deviation
- Range
- Variance
7
State the 2 different types of scales
Interval scales
Ratio scales
Ratio scales
8
Outline interval scales
Measurement where it is possible to consider diffeneces between scale points
9
Outline ratio scales
Has a true zero point (0 indicates absence of something)
10
State the 2 types of descriptive statistics
Measures of central tendency
Measures of dispersion
Measures of dispersion
11
Outline measures of central tendency
Tendency for observations to group themselves about a certain value/category
Don't spread evenly across range of values/categories
Don't spread evenly across range of values/categories
12
Outline measures of dispersion
How spread out the data is
How the data is clustered about the measure of central tendency
How the data is clustered about the measure of central tendency
13
Outline dispersion
Assesses the goodness of fit of a model by looking at how different real data is to the data produced from the model
14
State the 3 models of dispersion
Sum of squares
Variance
Standard deviation
Variance
Standard deviation
15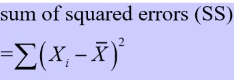
How to calculate sum of squared errors
16
The smaller the sum of squared errors...
- the better the fit of the model
- the worse the fit of the model
17
The more data points...D
- the higher the sum of squared eroors and hence the error estimate
- the lower the sum of squared eroors and hence the error estimate
18
Why might variance be used?
To overcome bias in larger samples
19
When is standard deviation used?
Used for populations
20
Define the sampling distribution of the mean
The variationin the sample means found between samples
21
Define the standard error of the mean
Estimates how much the sample means will vary from the standard deviation of the sampling distribution of the mean
22
When is standard error of the mean used?
When calculating spread of the mean in samples
23
Evaluate the mean
+ Takes into account all the values
+ Minimises sum of squared errors
- Sensitive to anomalous data points
+ Minimises sum of squared errors
- Sensitive to anomalous data points
24
Evaluate the median
+ Less affected by outliers in comparison to mean
+ Minimises errors
+ Minimises errors
25
Evaluate the mode
+ Most appropriate for category variables
+ Minimises errors
+ Minimises errors
26
How do you calculate the interquartile range?
Upper quartile - lower quartile
27
Advantages of presenting data (eg. as graphs)
+ Make sense of lots of data
+ Classify and categorise data
+ Find relationships among data
+ Determine patterns and trends
+ Detect anomalies
+ Predict future trends
+ Classify and categorise data
+ Find relationships among data
+ Determine patterns and trends
+ Detect anomalies
+ Predict future trends
28
Describe box and whisker plots
Half dataset in the box
Medium splits the box
Max and min shown by whiskers
Medium splits the box
Max and min shown by whiskers
29
How are anomalies identified in box and whisker plots?
Any whisker more than times the length of the box
30
Name another plot that can be combined with box plots
Violin plot
31
Define distribution
When a quantitative variable is arranged in order of increasing size
32
2 advantages of arranging data in the form of a distribution
+ Easy to identify man and min values, so easy to calculate range
+ Allows median to be found
+ Allows median to be found
33
Equation for determining the number of intervals needed in a graph
Square root of n (no. of data point)
34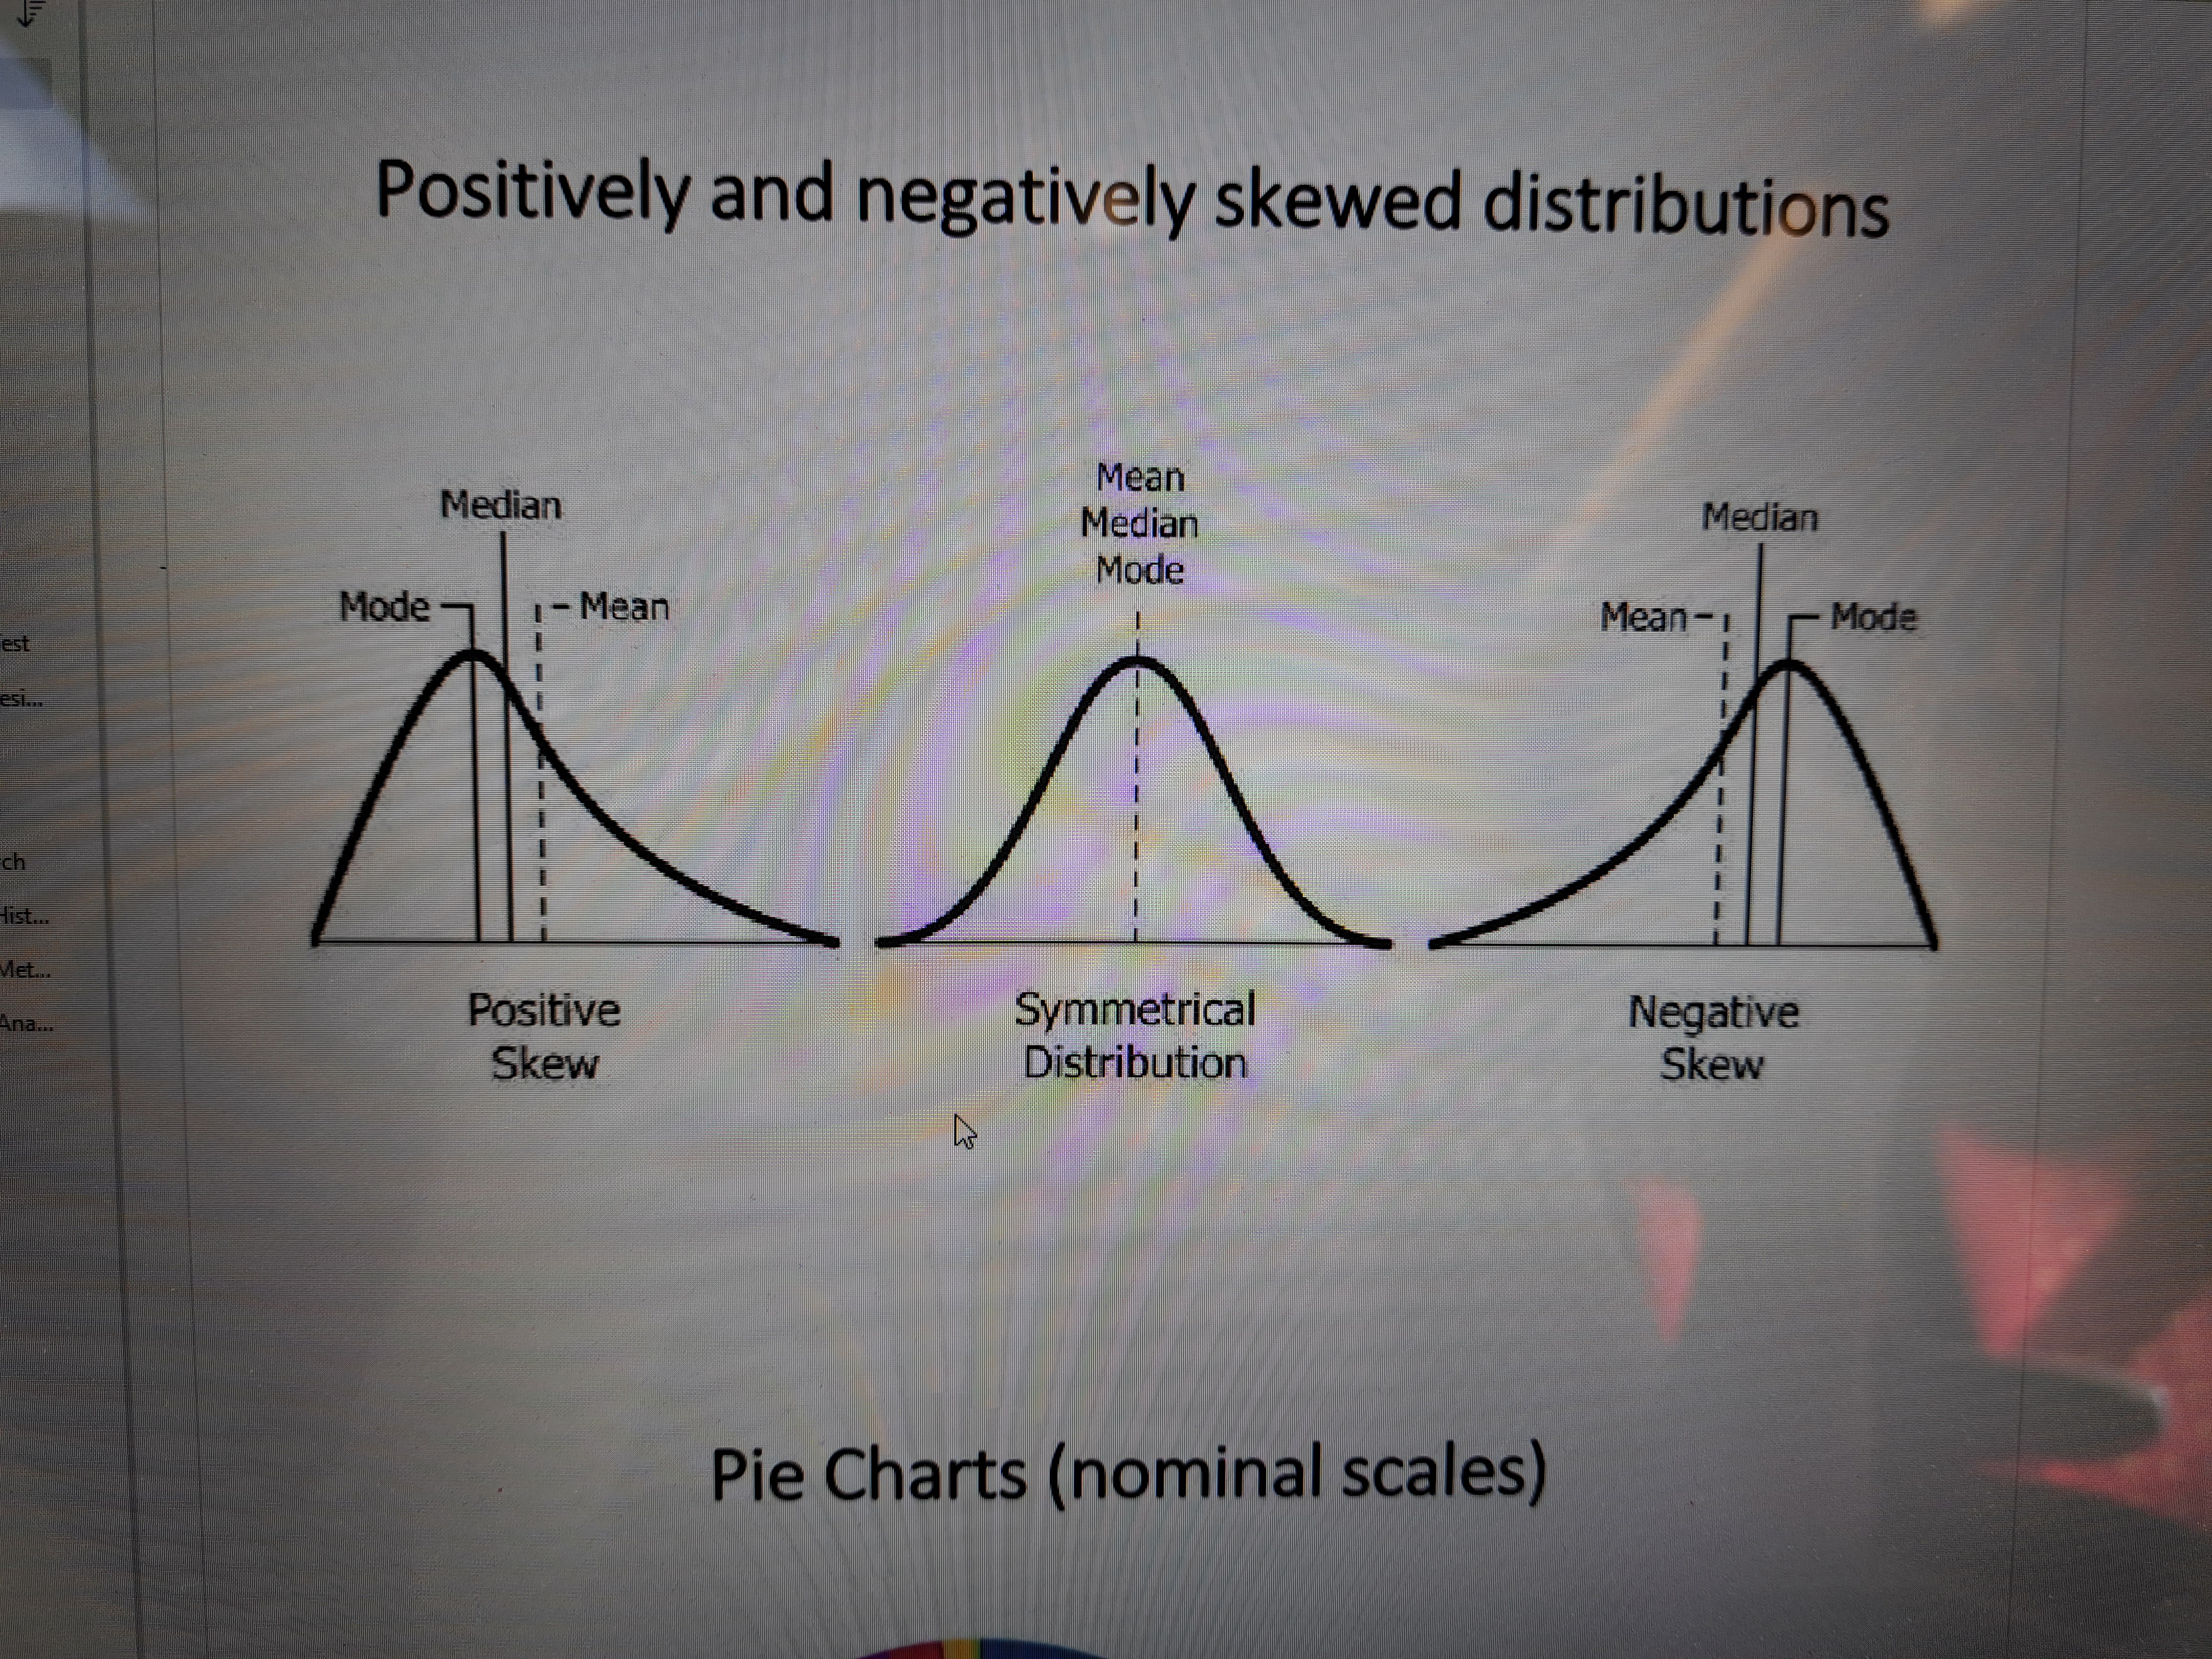
Draw a positive and negative skew
35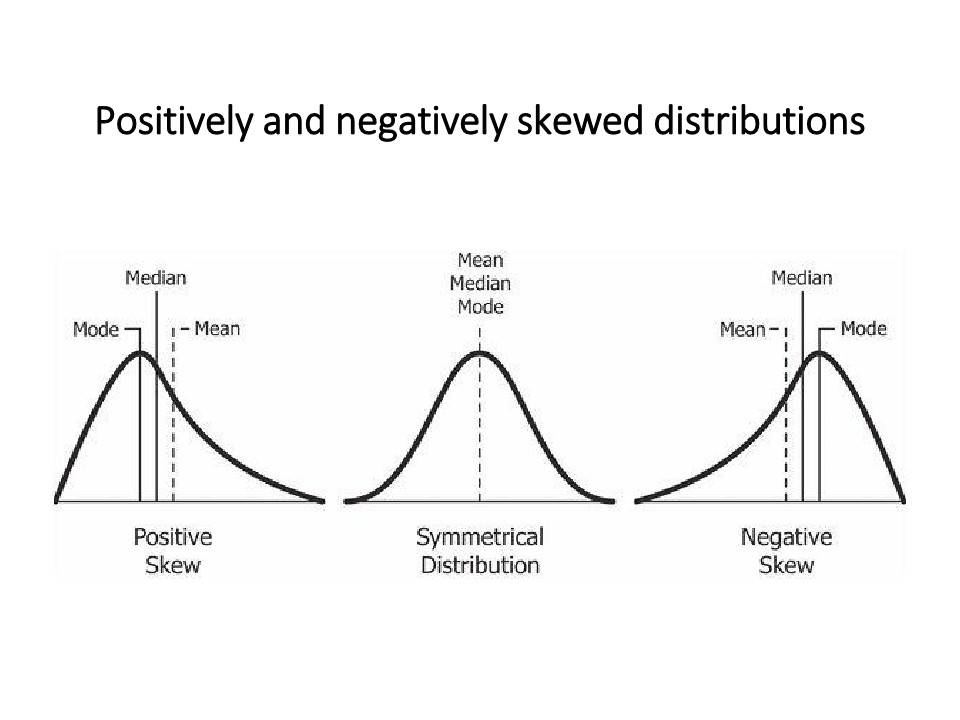
Occultation d’image : retrouve les étiquettes masquées
36
Pie charts use...
- Nominal scales
- Ordinal scales
- Quantity scales
37
Column graphs use...
- Nominal scales
- Ordinal scales
- Quantity scales
Plus de flashcards : Mathématiques
Mathematik Prüfung WiSe24/25Mathématiques · AllemandronnyCorrelation + RegressionMathématiques · AnglaisAnaïsProbability & StatisticsMathématiques · AnglaisSarahCalc ExamMathématiquesae20202024theorems to proveMathématiques · AnglaisLayneFurther maths PureMathématiques · AnglaisIanto06Chapitre 10 : Les lois de la dynamiqueMathématiques · FrançaisPiouProbability EquationsMathématiques · AnglaisAVrai/Faux SuitesMathématiques · FrançaisCarolineTransportation EngineeringMathématiques · AnglaisMPLEStatisticsMathématiques · AnglaiseleanorCIMA FormulaMathématiques · AnglaisElla
Tous les decks : Mathématiques
Révise ces decks dans l’app
Gratuit sur iPhone, Android, Mac et le web. Ajoute n’importe quel deck à ton compte en un tap.