Lecture61
Study these flashcardsFree · spaced repetition · iPhone, Android, Mac & web
All cards
1
What is the target condition?
The disease or state that we are trying to identify.
2
What is the index test?
The diagnostic test being evaluated that produces a test result.
3
What is the reference standard?
The method used to determine the animal’s true condition status for comparison with the index test.
4
What is unconditional probability?
The overall probability of a condition in a defined population; start with ALL animals.
5
What is conditional probability?
The probability of a condition among animals meeting a specific condition, such as P (disease | positive test); start with positive tests
6
What are the 4 possible diagnostic test outcomes?
True positive (TP), false positive (FP), false negative (FN), and true negative (TN).
7
Sensitivity
The percentage of animals WITH the target condition that test positive.
8
Sensitivity formula
TP ÷ (TP + FN) × 100.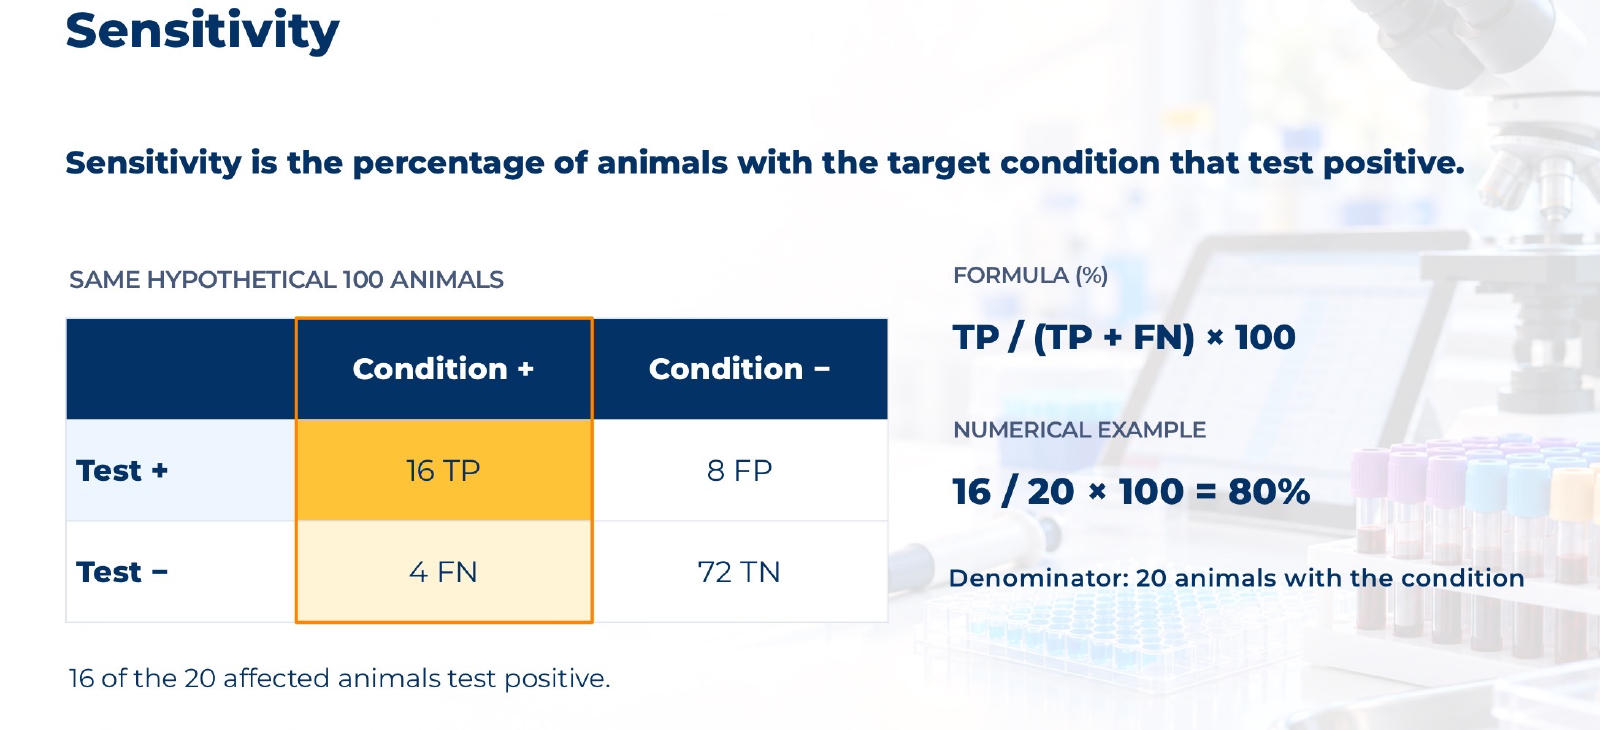
9
A highly sensitive test minimizes what error?
False negatives.
10
Specificity
The percentage of animals WITHOUT the target condition that test negative.
11
Specificity formula
TN ÷ (TN + FP) × 100.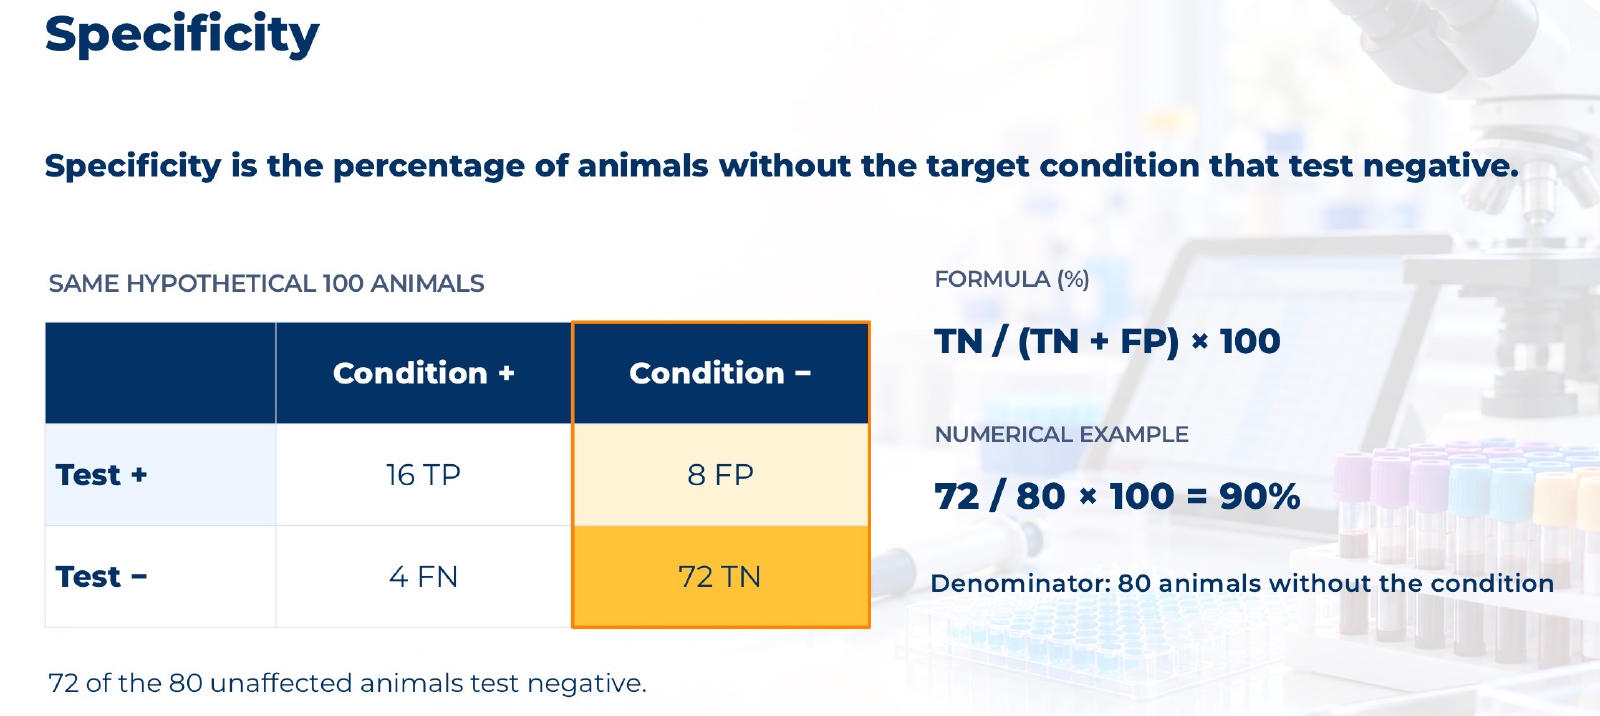
12
A highly specific test minimizes what error?
False positives.
13
Positive predictive value (PPV)
Among animals that TEST POSITIVE, the percentage that actually have the condition.
14
PPV formula
TP ÷ (TP + FP) × 100.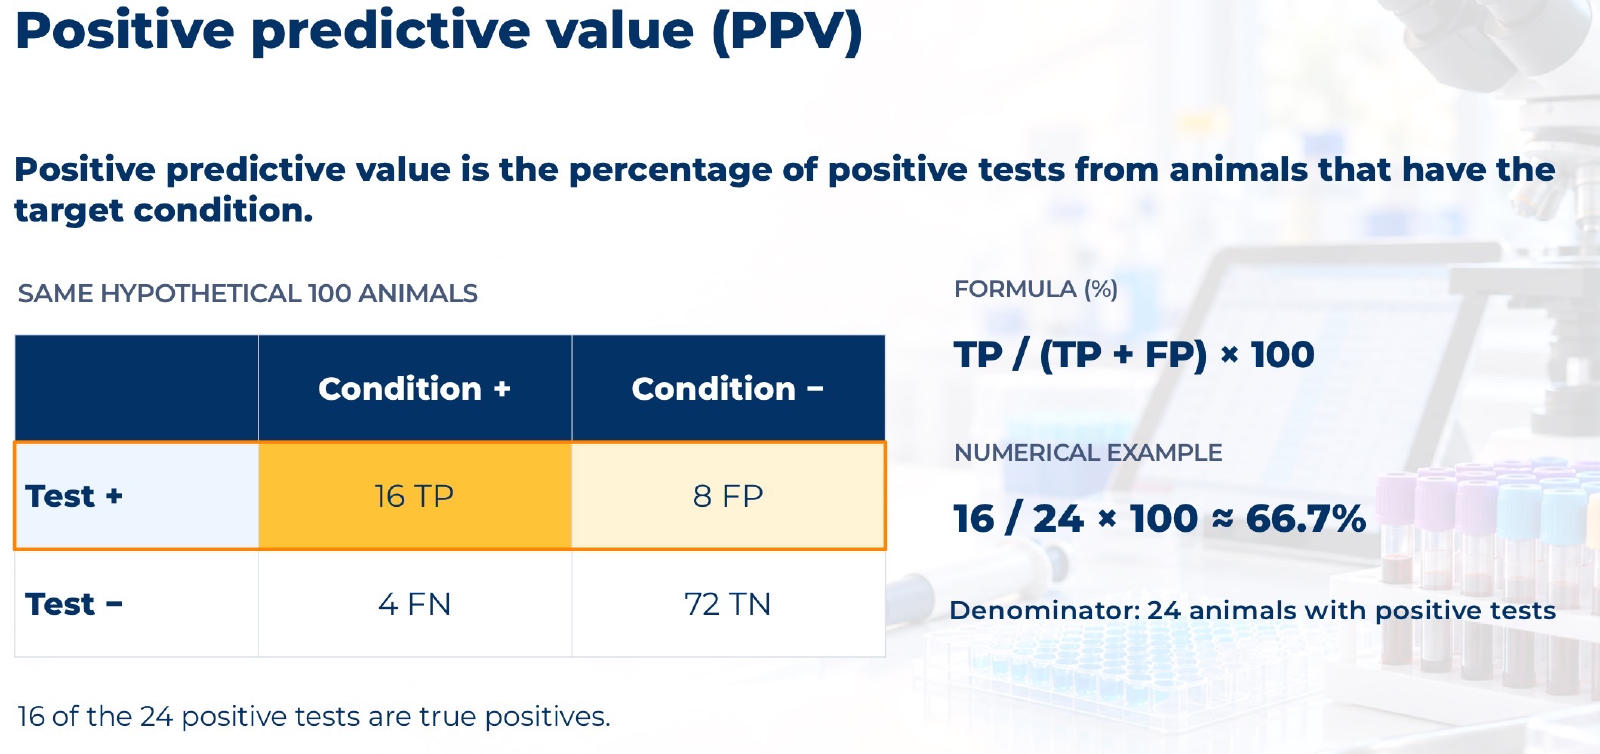
15
Negative predictive value (NPV)
Among animals that TEST NEGATIVE, the percentage that actually do not have the condition.
16
NPV formula
TN ÷ (TN + FN) × 100.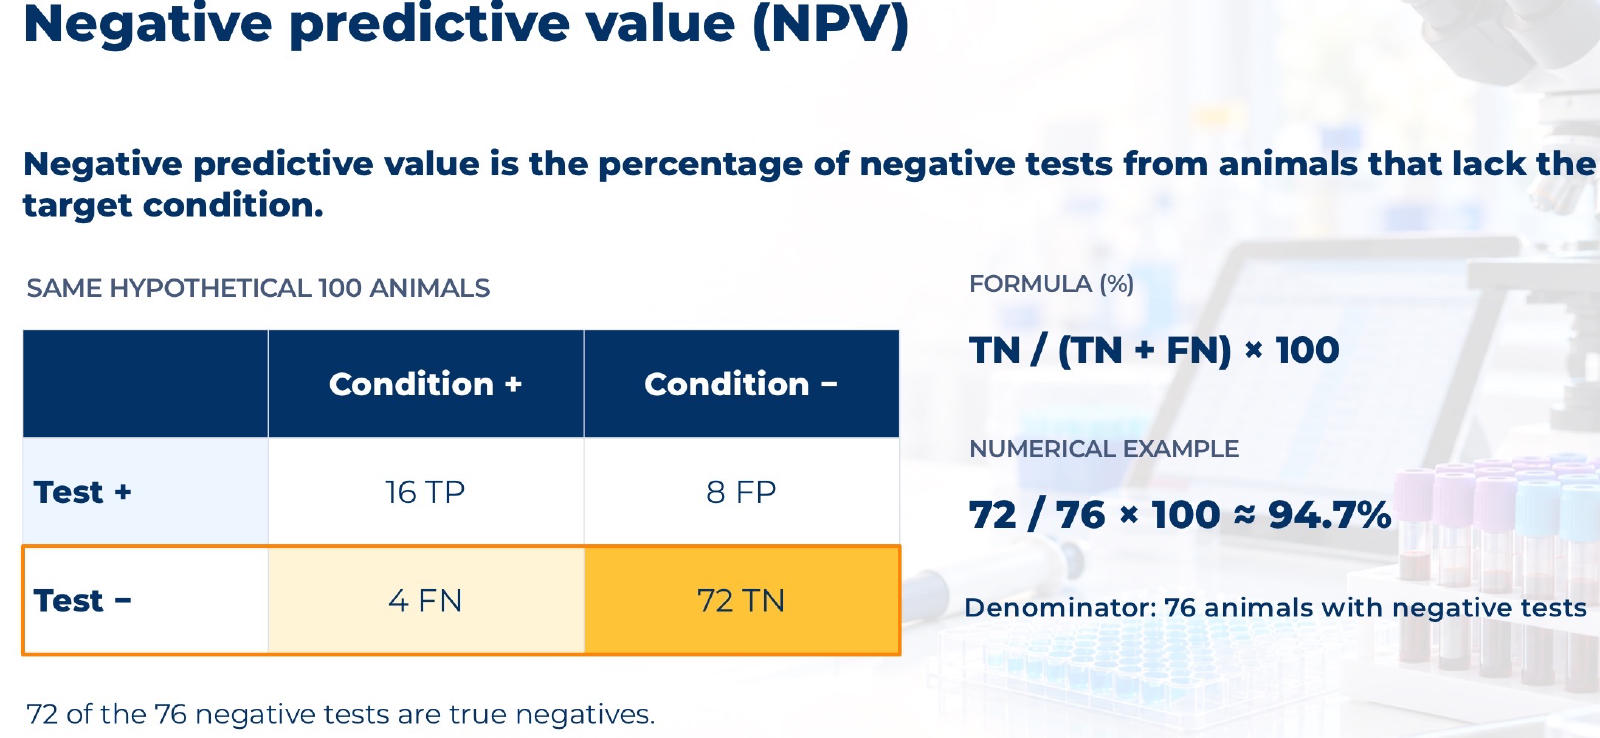
17
High-yield difference between sensitivity and PPV
Sensitivity starts with animals that HAVE the disease; PPV starts with animals that TEST POSITIVE.
18
High-yield difference between specificity and NPV
Specificity starts with animals WITHOUT the disease; NPV starts with animals that TEST NEGATIVE.
19
True prevalence
The percentage of ALL animals that actually have the target condition.
20
True prevalence formula
(TP + FN) ÷ total population × 100.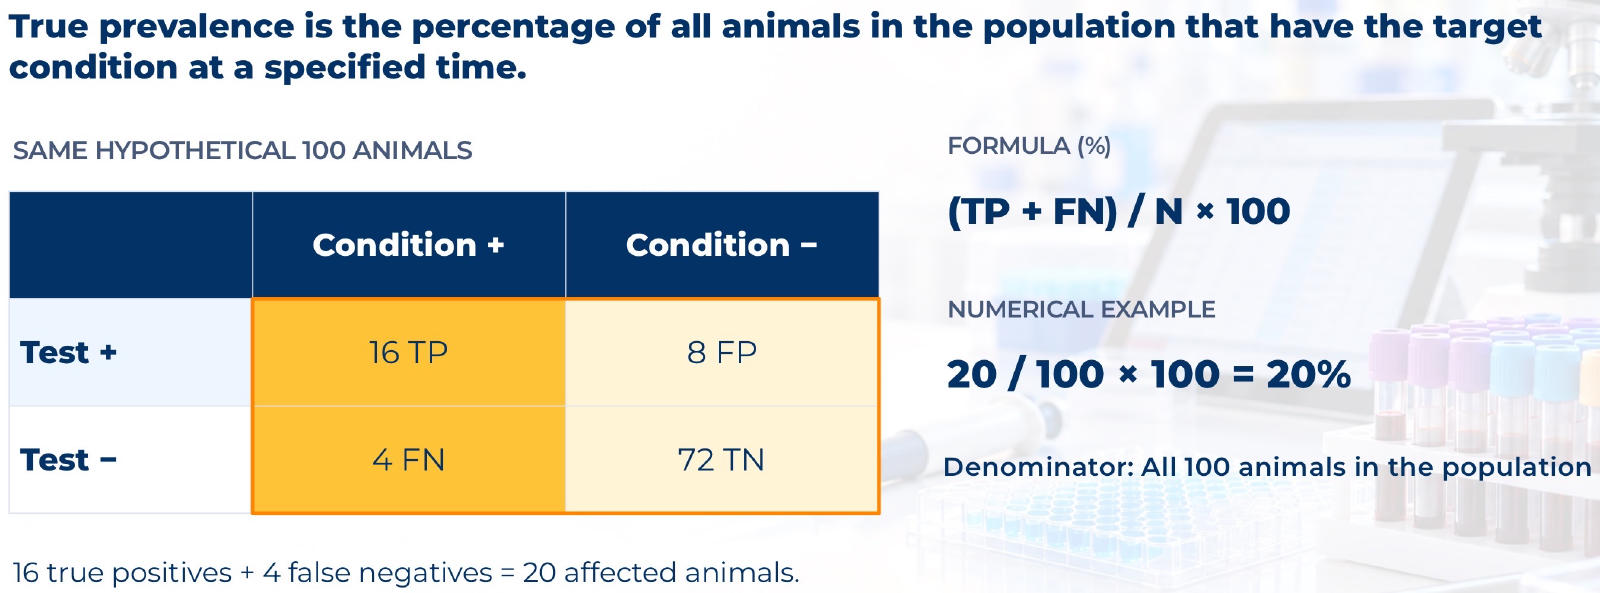
21
Apparent prevalence
The percentage of ALL animals that test positive.
22
Apparent prevalence formula
(TP + FP) ÷ total population × 100.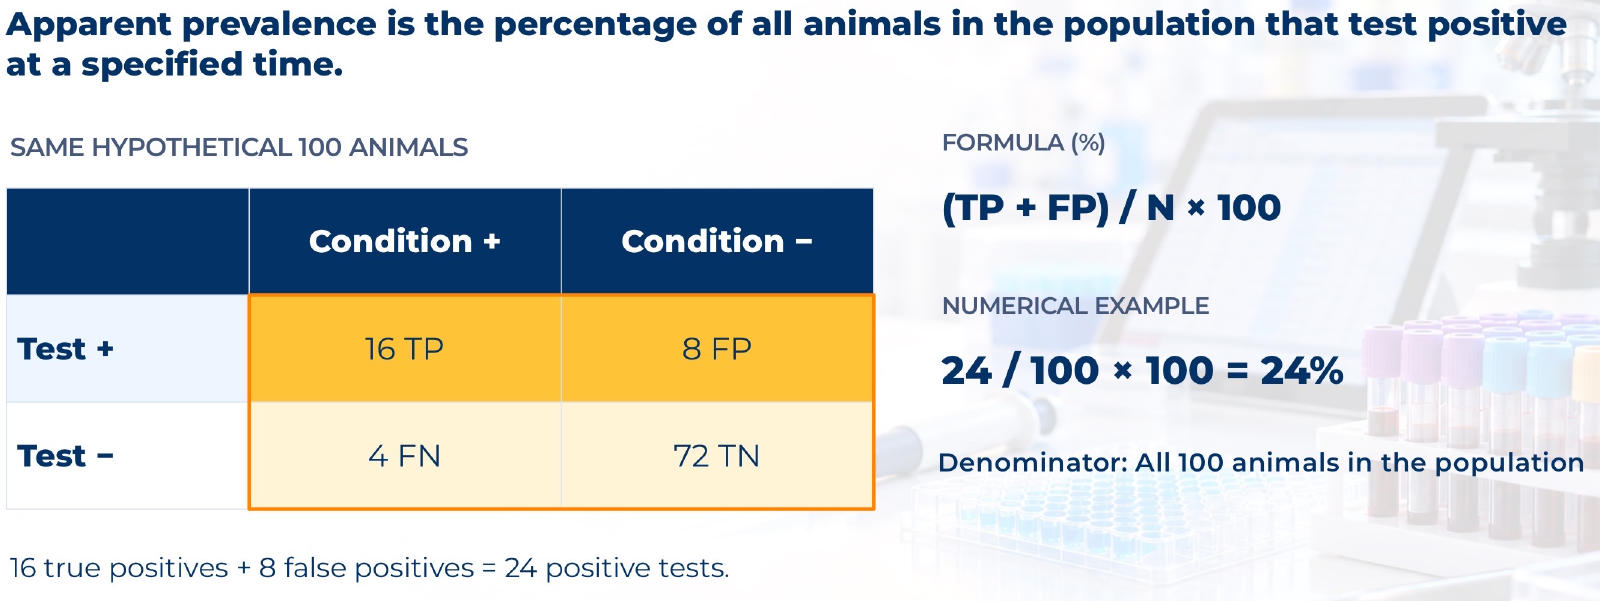
23
Why can apparent prevalence differ from true prevalence?
False positives and false negatives cause the number testing positive to differ from the number actually affected.
24
What is the biggest trick when choosing between sensitivity, specificity, PPV, and NPV?
Read the denominator first and ask which group of animals you are starting with.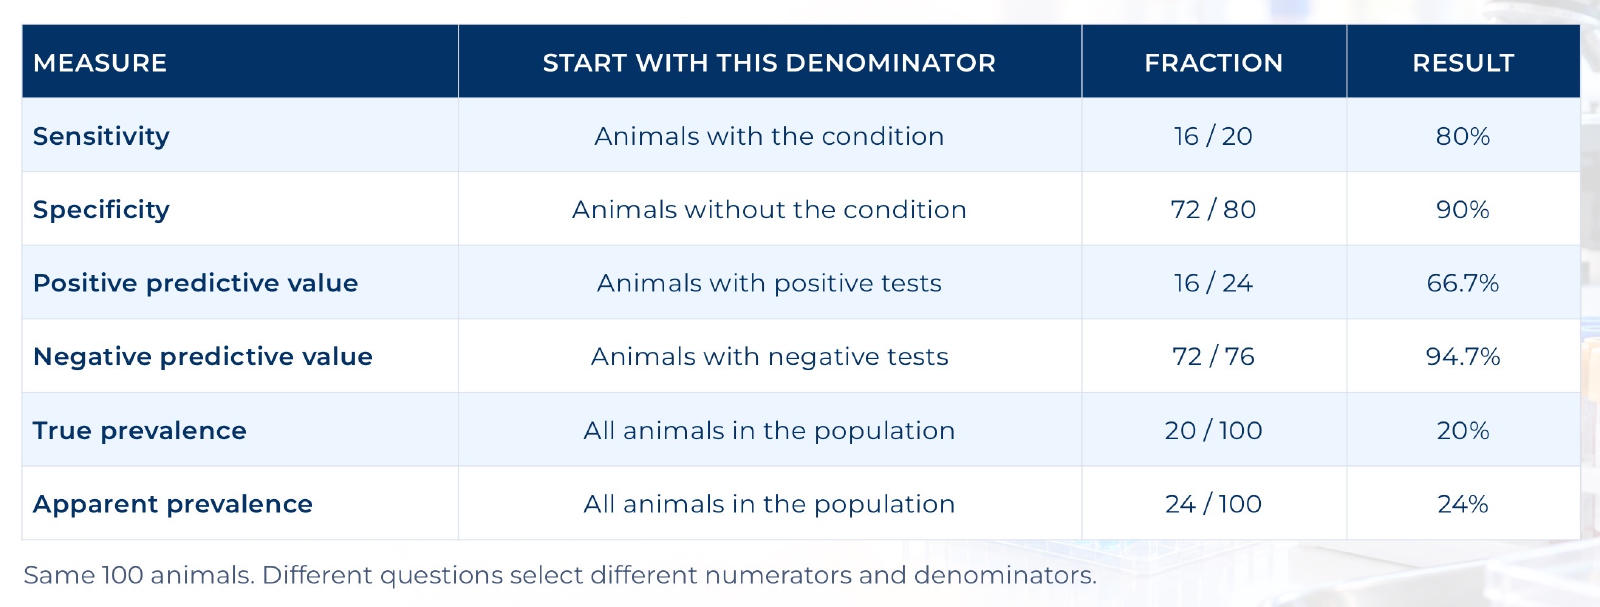
25
Prevalence vs risk
Prevalence measures EXISTING cases at a point in time; risk measures NEW cases occurring over an interval among animals initially at risk.
26
Why can’t a single snapshot of a population measure risk?
Risk requires following initially disease-free animals over time to identify NEW cases.
27
What happens when the diagnostic cutoff is raised in the lecture example?
Fewer animals test positive.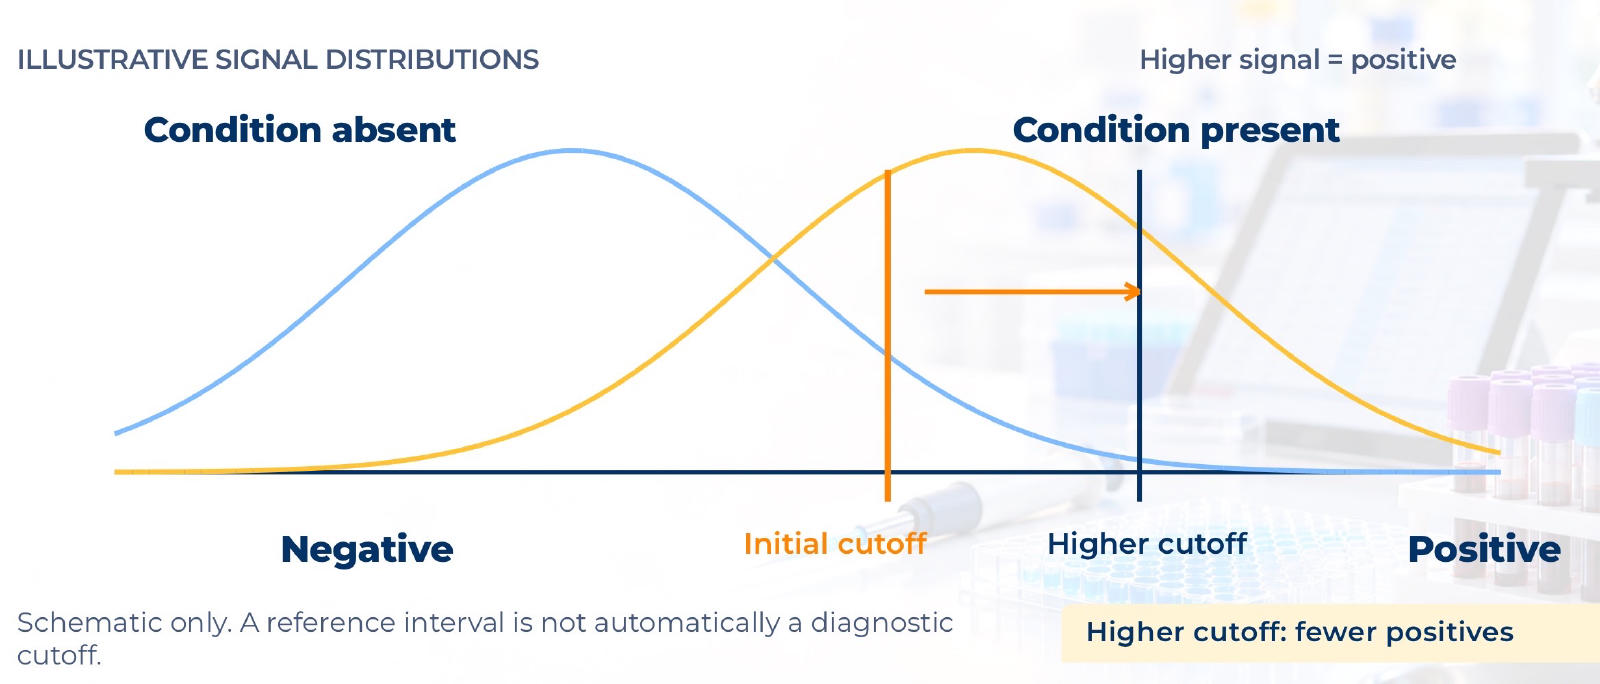
28
What is pretest probability?
The estimated probability that an animal has the condition BEFORE receiving the test result.
29
What is post-test probability?
The probability of the condition AFTER incorporating the diagnostic test result.
30
Why shouldn’t a diagnostic result be interpreted alone?
Its meaning depends on the animal, sample, disease stage, cutoff, prior probability, and clinical evidence.
31
What is precision?
Repeatability; repeated measurements give similar results.
32
Can a test be precise but inaccurate?
Yes. Results can be tightly grouped but consistently biased away from the true value.
33
Classification accuracy formula
(TP + TN) ÷ total population
34
A mastitis test has 95% sensitivity and 95% specificity in a herd with only 5% prevalence. What is the PPV in the lecture example?
50%; only half of the positive results are true positives.
35
Why can a seemingly good test have a PPV of only 50%?
When disease prevalence is low, the large number of unaffected animals can generate enough false positives to substantially lower PPV.
36
How does disease prevalence affect PPV?
Higher prevalence generally increases PPV; lower prevalence can greatly decrease PPV.
37
A test has 99% sensitivity and 99% specificity. At 25% prevalence, what is its PPV in the lecture example?
About 97%.
38
The same 99% sensitive and 99% specific test is used when prevalence is only 0.1%. What happens to PPV?
It falls to about 9%.
39
Why can 99% specificity coexist with only 9% PPV?
When disease is extremely rare, there are so many unaffected animals that even a small false-positive percentage can produce more false positives than true positives.
40
In 1,000 cats, 78 are truly infested with ear mites but 64 screen positive. Can you calculate sensitivity from these totals alone?
No. You need to know the overlap: how many of the 64 positive screens are true positives.
41
What does the ear-mite example teach about diagnostic data?
Knowing total true cases and total positive tests is not enough; you need the TP, FP, FN, and TN distribution to calculate test performance.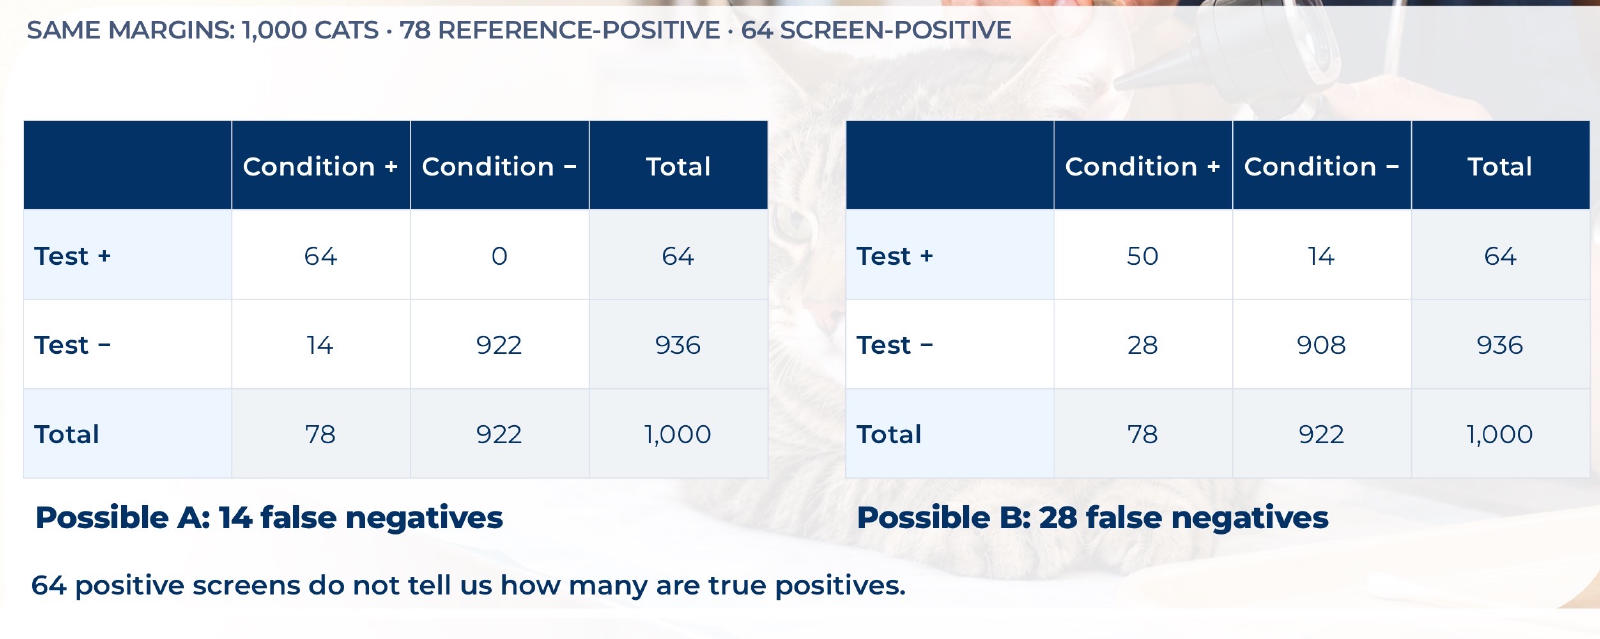
42
What does a group-level probability tell you about one individual animal?
It estimates uncertainty for that animal; it does NOT guarantee what will happen to that individual.
43
Sidney has an unexpectedly high glucose of 550 mg/dL. What should you do instead of immediately making a diagnosis?
Verify the unexpected result, assess clinical status and corroborating findings, then let the evidence and urgency guide care.
44
Why should Sidney’s low-normal T4 not automatically lead to a diagnosis?
A low-normal T4 value alone is not a diagnosis and must be interpreted with the rest of the clinical evidence.