Correlation + Regression
Study these flashcardsFree · spaced repetition · iPhone, Android, Mac & web
All cards
1
Outline experimental research methods
Examine difference between 2 variable
IV usually manipulated to determine causal effect on DV
Interested in systematic variation caused by manipulating the IV
Unsystematic (random) variation controlled so causal statements can be made
IV usually manipulated to determine causal effect on DV
Interested in systematic variation caused by manipulating the IV
Unsystematic (random) variation controlled so causal statements can be made
2
Outline correlation research methods
Data collected on 2 or more variables
Multiple levels of IV exist
Organise data that naturally exists in the world
Situational variables not controlled (high unsystematic variation)
Can't make causal statements
Good at determining relationships between variables
Multiple levels of IV exist
Organise data that naturally exists in the world
Situational variables not controlled (high unsystematic variation)
Can't make causal statements
Good at determining relationships between variables
3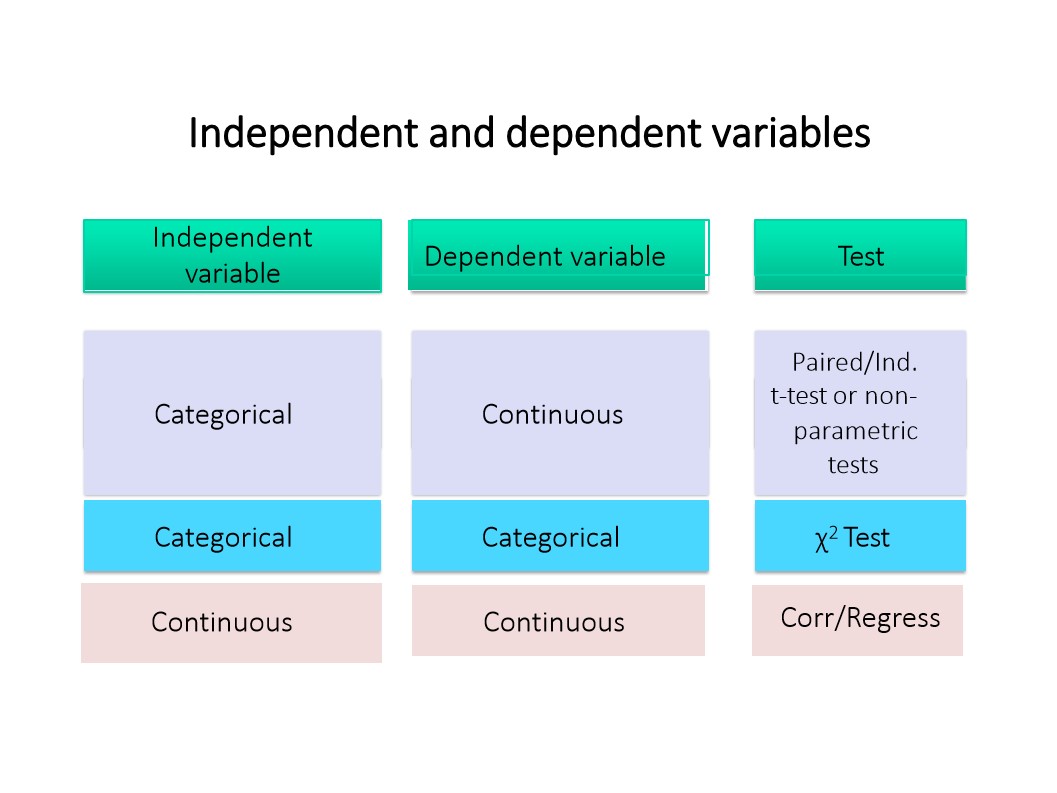
Image occlusion: name the hidden labels
4
Define variance
Spread of data
Extent to which data deviates from mean
Extent to which data deviates from mean
5
Define covariance
Extent to which scores of 2 variables differ from their respective means
Whether or not 2 variables change in relationship to each other
Whether or not 2 variables change in relationship to each other
6
What does the product-moment correlation coefficient measure?
Strength and direction of relationship
Standardised the covariance
Value between -1 and +1
Standardised the covariance
Value between -1 and +1
7
Outline one limitation of caluclating r
Even a small r value can be highly significant if the sample is large enough
8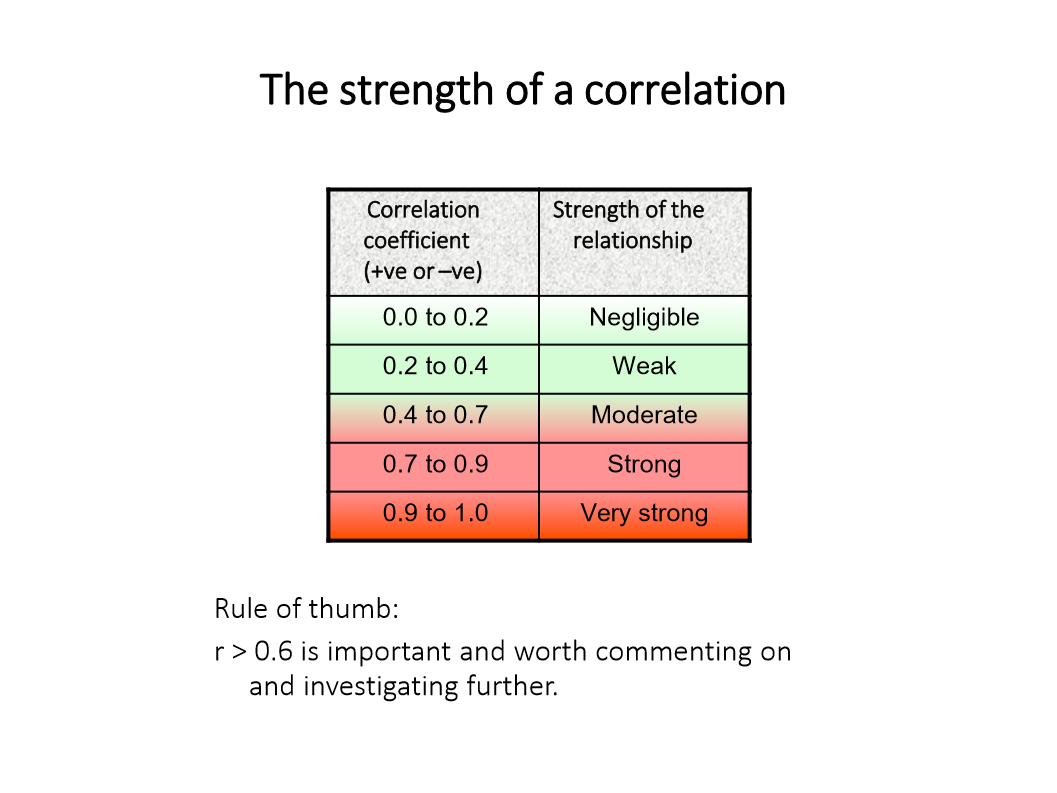
Image occlusion: name the hidden labels
9
What does r squared tell us?
The importance of the r statistic, and whether or not it is significant
Tells us how much variance in one variable can be explained by variation in the other
R squared is a measure of effect size
Doesn't tell us direction of relationship
Tells us how much variance in one variable can be explained by variation in the other
R squared is a measure of effect size
Doesn't tell us direction of relationship
10
If r squared is (0.8)^2 for a correlation between 2 variables...
64% observed variance can be accounted for by regression line model
11
What do high r squared values indicate?
Indicates regression line that is a good fit for the observed data
12
Difference between the total sum of squares and the residual sum of squares
SSt = sum of squared differences between mean and observed data
SSr = sum of squared differences between regression lone and observed data
SSr = sum of squared differences between regression lone and observed data
13
What does the model sum of squares represent?
Improvement in predictions using Regression line over the mean
14
How to calculate model sum of squares?
SSm = SSt - SSr
15
How to calculate r squared?
R squared = SSm ÷ SSt
16
What is regression analysis used for?
Making predictions
Predicts value of variable given the value of another
Predicts value of variable given the value of another
17
Outline the line of best fit
Acts like a measure of central tendency
Reduces data to one summary statistic
Attempts to average out variations
Reduces data to one summary statistic
Attempts to average out variations
18
The weaker the correlation...
- the smaller the number of possible lines of fit
- the greater the number of possible lines of fit
19
How to calculate line of best fit
y with hat = a + bx
20
How to calculate residual error for line of best fit
y - y with hat
21
How to calculate sum of squared errors for a line of best fit
Sum of (y - y with hat)^2
22
How is the sum of squares errors minimised for a line of best fit?
Values of a and b are picked in order to minimise it
23
How to calculate intercept and slope for line of best fit on calculato
Same procedure for correlations coefficient
Shift
Reg
A = intercept
B = slope
Shift
Reg
A = intercept
B = slope
24
3 assumptions for correlations
IV and DV should be measured using interval or ratio scales (HAS to be continuous data)
That there is a linear relationship between IV and DV
Both variables normally distributed (might be skewed by extreme outliers)
That there is a linear relationship between IV and DV
Both variables normally distributed (might be skewed by extreme outliers)
25
6 assumptions for regression/Pearson's correlation
Both variables must be measured using interval or ratio scale
Both variables must be normally distributed
Predictor variables should have non zero variance
All values of outcome variable should be independent from one another
That a linear relationship exists between independent and dependent variables
Data drawn from a random sample
Both variables must be normally distributed
Predictor variables should have non zero variance
All values of outcome variable should be independent from one another
That a linear relationship exists between independent and dependent variables
Data drawn from a random sample