Stats Terms
Study these flashcardsFree · spaced repetition · iPhone, Android, Mac & web
All cards
1
Population
Entire gorup of individuals that we want information about
2
Sample
Small gorup chosen from population we examine to gather informaiton about
3
Voluntary Response Sampling
People choose themselves (Web poll, call in poll)
4
Convenience Sampling
Choosing people who are easist to readch
5
Simple Random Sample (SRS)
Each member of the population has an equal chance to be chosen
6
Systematic Sampling
Choose every nTH itme (EX: Everyt 10th)
7
Cluster Sampling
Population divided into groups. Randomly select clusters, measure all individuals in those clusters (ALL FROM SOME)
8
Stratified Sampling
Population divided into groups. Take SRS from every group (SOME FROM ALL)
9
Undercoverage
Entire population targeted is not included in design of sample
10
Non-response
Individual cannot be selected or refused to cooperate
11
Response Bias
Individual's response influenced in some way by the interviewer
12
Retrospective Study
Looks backwards in time
13
Prospective Study
Looks forewards in time
14
Principles of Experimental Design
1.) CONTROL the experiment conditons for all treatment groups to assure all lurking variables do not bias the results
2.) Experimental units must be RANDOMLY assigned to treatements
3.) REPLICATION music be used to reduce chance of variations in results
4.) Placebo or control MUST be used as one of the treatements
5.) Medical experiments MUST be double blind
2.) Experimental units must be RANDOMLY assigned to treatements
3.) REPLICATION music be used to reduce chance of variations in results
4.) Placebo or control MUST be used as one of the treatements
5.) Medical experiments MUST be double blind
15
Experimental Units/ Subjects
Indviduals you are studying in the experiment
16
Population
Entire gorup of individuals that we want information about
17
Explanatory (Independent) variables (maybe have several) thought to influence response (outcome / dependent) variable studied. Combine specific values (levels) of each factor to form a treatment
Factors
Explanatory (Independent) variables (maybe have several) thought to influence response (outcome / dependent) variable studied. Combine specific values (levels) of each factor to form a treatment
18
Variable that is not a,ong explanatory/ response variables, but influence interpretation of the relationationship
Lurking Variable
Variable that is not a,ong explanatory/ response variables, but influence interpretation of the relationationship
19
Addition explanatory variable that affects response but that is not considered when exploring explanatory/ response relationship
Confounding Variable
Addition explanatory variable that affects response but that is not considered when exploring explanatory/ response relationship
20
Dummy Treatment
Placebo
Dummy Treatment
21
Experiment where neither patient not researcher knows who had which treatement
Double Blind
Experiment where neither patient not researcher knows who had which treatement
22
Experiement where only participants do not know which treatment they got assigned
Single Blind
Experiement where only participants do not know which treatment they got assigned
23
Observed effect so large tthat it would rarly occur by chance
Statistically Significant
Observed effect so large tthat it would rarly occur by chance
24
Compeltely random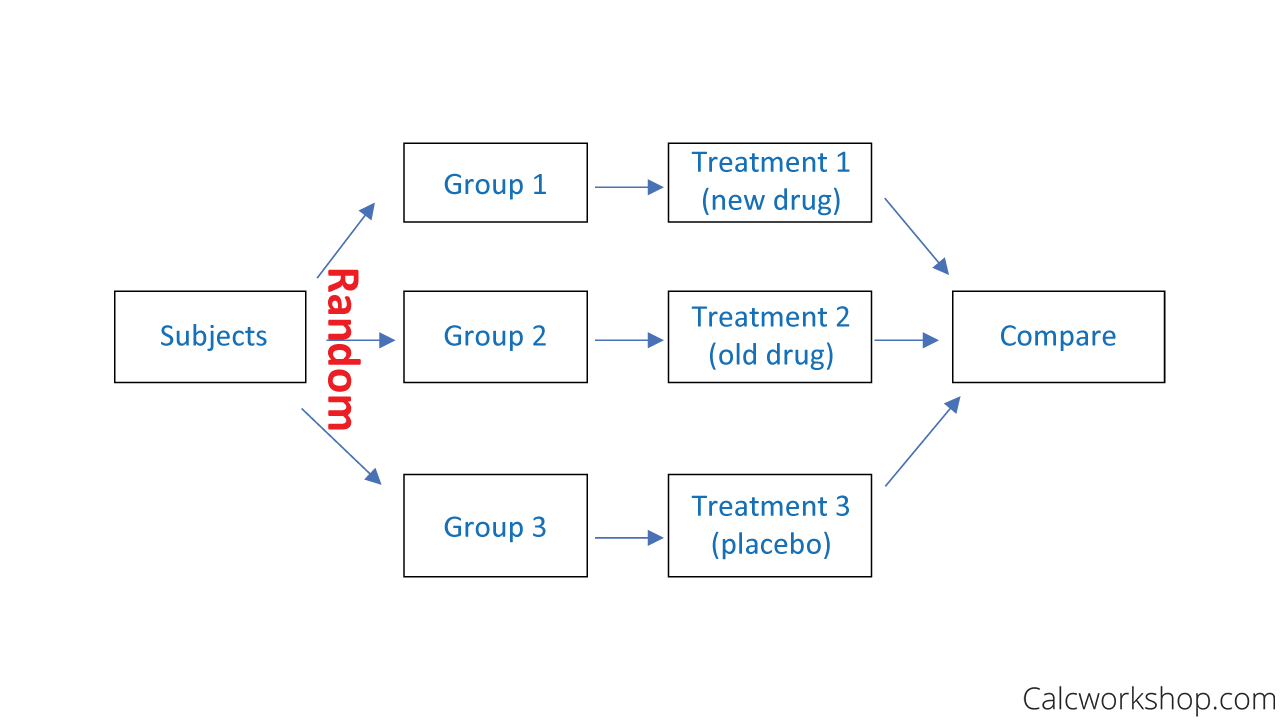
Completely Randomized Design
Compeltely random
25
Subjects paried accoridng to variables that affect response and then randomly assaigned treatment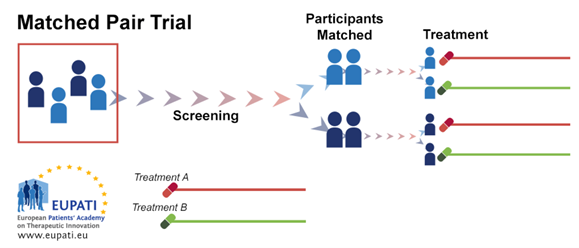
Matched Pairs
Subjects paried accoridng to variables that affect response and then randomly assaigned treatment
26
Block Design
Blocks of similar subjects are formed and then randomly assigned to treatment groups 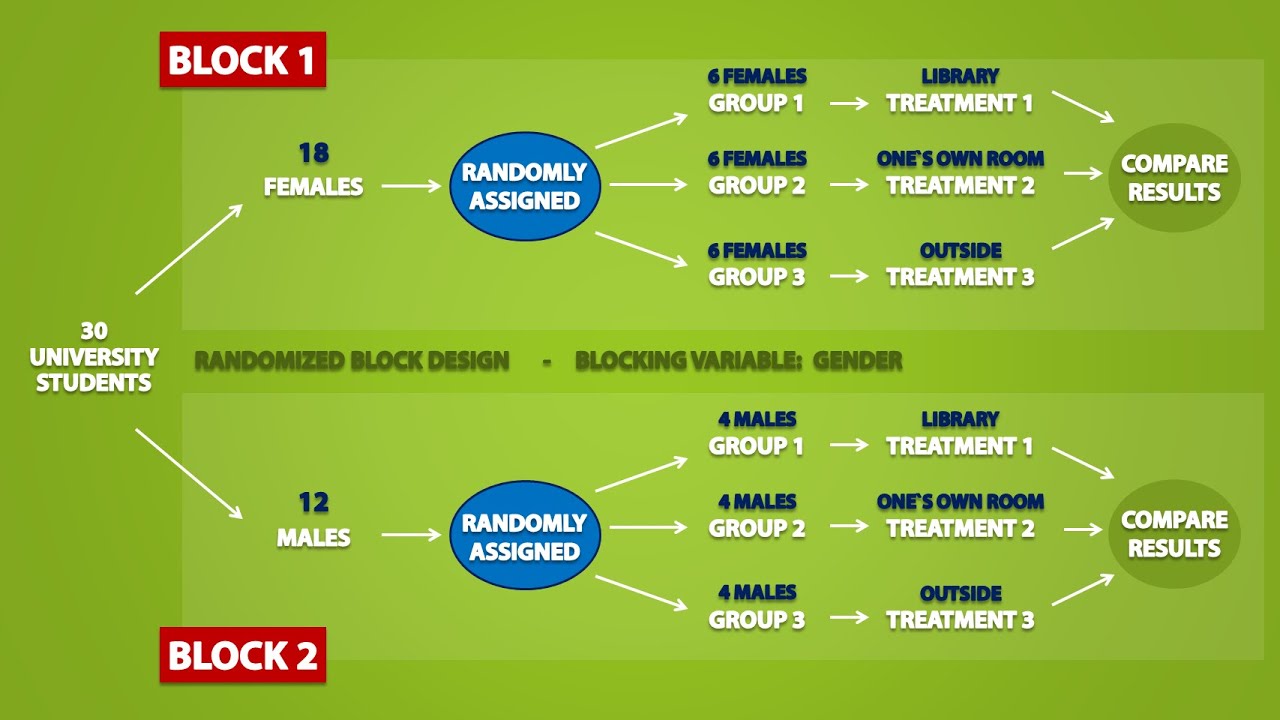
27
Histograms, stem plots, split stem plots, time plots
Graphing Quantitative Variables
Histograms, stem plots, split stem plots, time plots
28
Interpreting Graphs
Shape, center, spread, outliers
29
Symmetry, skewness, bimodal, unimodal, bell-shaped
Shapes
Symmetry, skewness, bimodal, unimodal, bell-shaped
30
Correlation does not imply causation
What does correlation not imply?
Correlation does not imply causation
31
Middle Value
Median
Middle Value
32
Measures spread or variability of the data.
Variance and Standard Deviation
Measures spread or variability of the data.
33
Middle value of the smallest half fo data
First Quartile (Q1)
Middle value of the smallest half fo data
34
Middle vlaue of largest half of data
Third Quartile (Q3)
Middle vlaue of largest half of data
35
Minimum
Q1
Median
Q3
Maximum
Five Number USmmary
Minimum
Q1
Median
Q3
Maximum
36
Symetric Data USE:
Mean and standard deviation to measure center and Spread
37
Median and IQR
Skewed / Outliers USE:
Median and IQR
38
Z Score
Used to compare values from two different normal distributions
39
Displays relationship between two quantitative variables
Scatter Plot
Displays relationship between two quantitative variables
40
What are the descriptors of a scatter plot?
1.) Form: Linear, curved, clusters
2.) Direction: Positive or negative association
3.) Strength: How close points lie to a simple form (Such a line)
4.) Outliers: Extreme Observations
2.) Direction: Positive or negative association
3.) Strength: How close points lie to a simple form (Such a line)
4.) Outliers: Extreme Observations
41
Measures strength and direction of a linear relationship between two variables
Correlation Coefficient (r)
Measures strength and direction of a linear relationship between two variables
42
$R^2$
Square of correlation coefficient Measures the predictive power of the equation
43
Residual
Observed y - Predicted y
Negative Residual: Prediction too high
Positive Residual = Prediction too low
Negative Residual: Prediction too high
Positive Residual = Prediction too low
44
Making predictions outside the range for which you have data
Extrapolation
Making predictions outside the range for which you have data
45
Correlation does not imply causation
What does correlation not imply?
Correlation does not imply causation