Q3 econ3333
Study these flashcardsFree · spaced repetition · iPhone, Android, Mac & web
All cards
1
The ordinary least square (OLS) finds a fitted Y to minimize the mean square error.
In the above figure, the circle point indicates the observed sample while the read line is fitted Y as
.
Overall, ____________ is the case of the OLS
plot A
plot B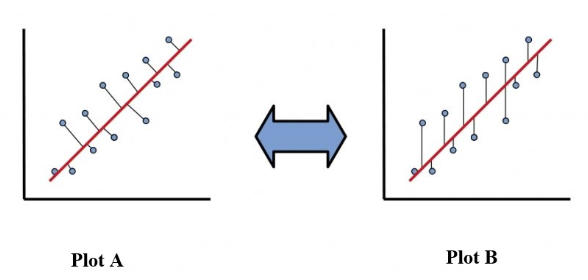
In the above figure, the circle point indicates the observed sample while the read line is fitted Y as
.
Overall, ____________ is the case of the OLS
plot A
plot B
plot B
2
X has P dimensions and P independent variables are highly correlated.
In this case,
the coefficient for high dimensional correlated independent variables will be __________ when all other assumptions are valid, excluding high correlation among independent variables.
Therefore, we cannot trust the P-value for the hypothesis test for the coefficient.
biased and the smallest variance (i.e., efficient) estimator
unbiased and the smallest variance (i.e., efficient) estimator
unbiased and non-smallest variance (i.e., inefficient) estimator
biased and non-smallest variance (i.e., inefficient) estimator
In this case,
the coefficient for high dimensional correlated independent variables will be __________ when all other assumptions are valid, excluding high correlation among independent variables.
Therefore, we cannot trust the P-value for the hypothesis test for the coefficient.
biased and the smallest variance (i.e., efficient) estimator
unbiased and the smallest variance (i.e., efficient) estimator
unbiased and non-smallest variance (i.e., inefficient) estimator
biased and non-smallest variance (i.e., inefficient) estimator
unbiased and non-smallest variance (i.e., inefficient) estimator
3
Based on the above figure, two vectors, PC1 and PC2, are __________________.
Two nonzero vectors are orthogonal vectors when they are linearly independent.
orthogonal (i.e., perpendicular)
non-orthogonal (i.e., non-perpendicular)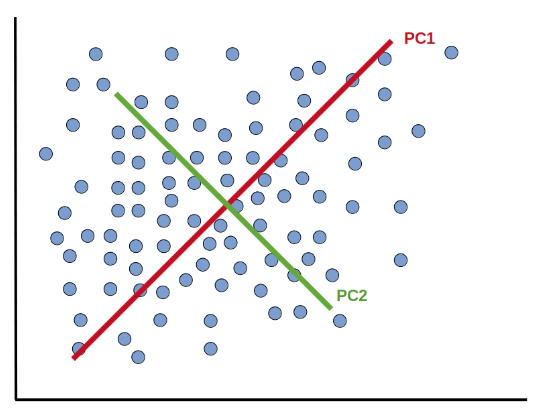
Two nonzero vectors are orthogonal vectors when they are linearly independent.
orthogonal (i.e., perpendicular)
non-orthogonal (i.e., non-perpendicular)
orthogonal
4
Based on the above figure, the sum of variance between the PC and each observed sample in the PC1 vector is ______________ that of the PC2 vector.
smaller
larger
the same as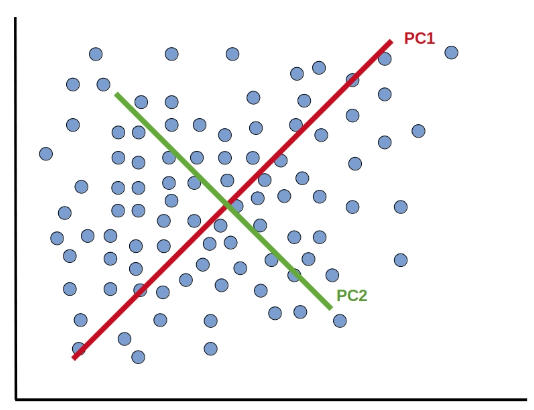
smaller
larger
the same as
larger
5
Let's assume there is a matrix for 1000 variables that are highly correlated.
Therefore, an economist wants to generate the matrix with 5 variables from the original matrix while containing useful information from the original matrix as much as the economist can.
In this case, we have _______________ in the matrix, and it is the case of dimension _____________
feature only, dimension expansion
feature and label, dimension reduction
feature only, dimension reduction
feature and label, dimension expansion
Therefore, an economist wants to generate the matrix with 5 variables from the original matrix while containing useful information from the original matrix as much as the economist can.
In this case, we have _______________ in the matrix, and it is the case of dimension _____________
feature only, dimension expansion
feature and label, dimension reduction
feature only, dimension reduction
feature and label, dimension expansion
feature only, dimension reduction
6
Unsupervised learning is the case when we have ___________________
feature only
feature and label
label only
feature only
feature and label
label only
feature only
7
In general, unsupervised learning can be used for ______________________
check all that apply
dimension reduction
reinforcement learning
clustering
knowledge discovery
segmentation
check all that apply
dimension reduction
reinforcement learning
clustering
knowledge discovery
segmentation
dimension reduction , clustering , knowledge discovery , segmentation
8
In linear regression, when all assumptions are valid, the coefficient for the independent variable is the best
linear unbiased estimator (OLS). Here, the best means the smallest variable (i.e., efficient estimator).
When independent variables are correlated, then, the coefficient for the independent variable is still unbiased
but inefficient (i.e., not the smallest variance); therefore, we cannot trust p-value for the hypothesis test.
In this case, before regression analysis, we can apply the principle component analysis
(PCA) to generate _________________________.
a greater number of correlated variables.
a greater number of uncorrelated variables.
a smaller number of correlated variables.
a smaller number of uncorrelated variables.
linear unbiased estimator (OLS). Here, the best means the smallest variable (i.e., efficient estimator).
When independent variables are correlated, then, the coefficient for the independent variable is still unbiased
but inefficient (i.e., not the smallest variance); therefore, we cannot trust p-value for the hypothesis test.
In this case, before regression analysis, we can apply the principle component analysis
(PCA) to generate _________________________.
a greater number of correlated variables.
a greater number of uncorrelated variables.
a smaller number of correlated variables.
a smaller number of uncorrelated variables.
a smaller # of uncorrelated variables
9
n: number of samples
P: number of variables (high dimensional matrix with large P)
p: number of variables (p<<P)
Principal Component Analysis (PCA) generates a low-dimensional matrix from a high-dimensional matrix .
In this case, the sample size n in the low-dimensional matrix from PCA will be ________________ that of the original high-dimensional matrix.
is smaller than
is greater than
the same as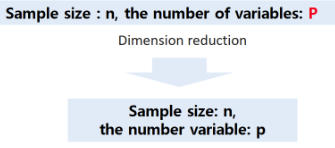
P: number of variables (high dimensional matrix with large P)
p: number of variables (p<<P)
Principal Component Analysis (PCA) generates a low-dimensional matrix from a high-dimensional matrix .
In this case, the sample size n in the low-dimensional matrix from PCA will be ________________ that of the original high-dimensional matrix.
is smaller than
is greater than
the same as
the same as
10
Which ones are true for Principal Component Analysis (PCA)?
check all that apply
PCA generates an uncorrelated low-dimensional matrix from a high-dimensional matrix.
PCA requires scaling such as normalization and standardization as it is sensitive in scale and unit of feature
PCA is for both continuous and discrete variables
PCA is based on singular vector decomposition (SVD)
check all that apply
PCA generates an uncorrelated low-dimensional matrix from a high-dimensional matrix.
PCA requires scaling such as normalization and standardization as it is sensitive in scale and unit of feature
PCA is for both continuous and discrete variables
PCA is based on singular vector decomposition (SVD)
PCA generates an uncorrelated low-dimensional matrix from a high-dimensional matrix.
PCA requires scaling such as normalization and standardization as it is sensitive in scale and unit of feature
PCA is based on singular vector decomposition (SVD)
PCA requires scaling such as normalization and standardization as it is sensitive in scale and unit of feature
PCA is based on singular vector decomposition (SVD)
11
We plan to apply the principal component analysis for the above dataset.
Here, please select two variables for which we cannot apply PCA.
city
discount
price
income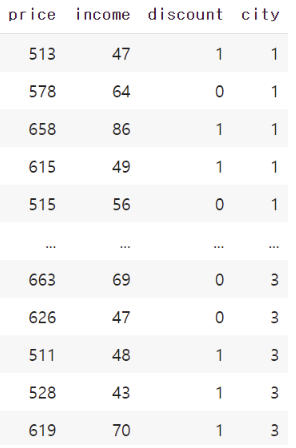
Here, please select two variables for which we cannot apply PCA.
city
discount
price
income
city, discount
12
Before PCA, we need to apply ___________________ because PCA is sensitive in units.
Random Sampling
Decision Tree
Random Forest
Standardization
Random Sampling
Decision Tree
Random Forest
Standardization
standardization
13
Let’s assume a high dimension matrix M with 31 x 4, where 31 is a sample size and 4 is the number of variables.
The first principal component (i.e., PC1) is a normalized linear combination of ____________ features in M.
3
4
31
2
The first principal component (i.e., PC1) is a normalized linear combination of ____________ features in M.
3
4
31
2
4
14
The explained variance of PC is in descending order.
1.____________ captures the largest variance in the sample data.
2.____________ capture the second largest variance in the sample data.
In addition, the direction of PC2 is orthogonal to PC1.
It means, PC1 and PC2 are 3.___________________.
PC1, PC2, correlated
PC2, PC1, uncorrelated
PC2, PC1, correlated
PC1, PC2, uncorrelated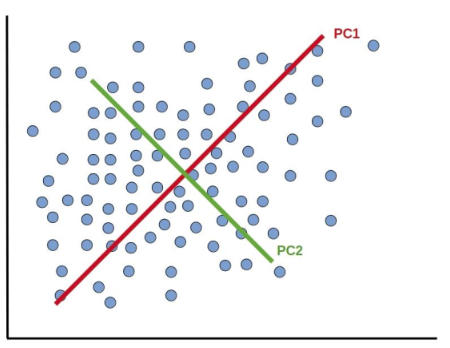
1.____________ captures the largest variance in the sample data.
2.____________ capture the second largest variance in the sample data.
In addition, the direction of PC2 is orthogonal to PC1.
It means, PC1 and PC2 are 3.___________________.
PC1, PC2, correlated
PC2, PC1, uncorrelated
PC2, PC1, correlated
PC1, PC2, uncorrelated
PC1, PC2, uncorrelated
15
Based on the above results, if we want to select the smallest number of the principal components that explain 80% of the total variance,
we need to select _________________.
pc1, pc2
pc1
pc1, pc2, pc3, pc4
pc1, pc2, pc3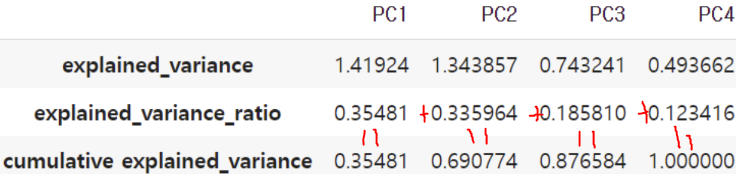
we need to select _________________.
pc1, pc2
pc1
pc1, pc2, pc3, pc4
pc1, pc2, pc3
pc1, pc2, pc3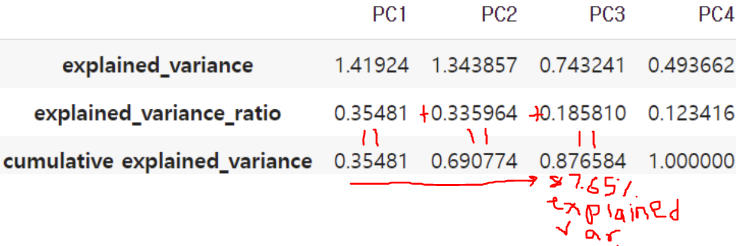
16
what does PC stand for? as in PCA
principal components, Princicpal components analysis
17
If we want to visualize high-dimension metrics (e.g., embedding vectors from text, image, and video) to 2
dimension space (i.e., Euclidean space), we can use _____________________
Logistic Regression
Principal Component Analysis (PCA)
Random Forest (RF)
XGboost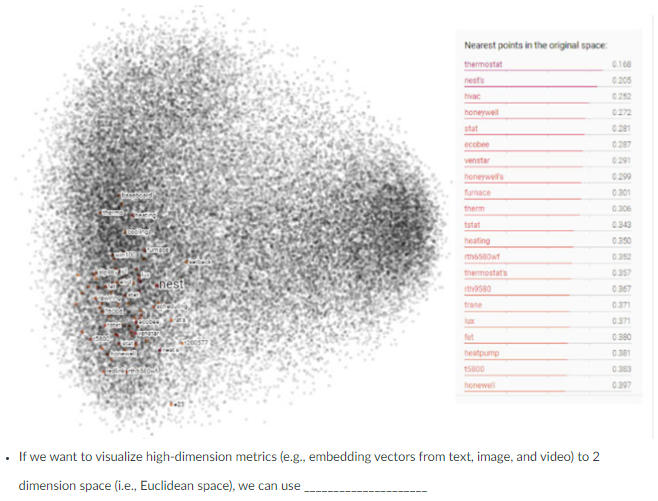
dimension space (i.e., Euclidean space), we can use _____________________
Logistic Regression
Principal Component Analysis (PCA)
Random Forest (RF)
XGboost
Principal Component Analysis (PCA)
18
Which one is not true about Principal Component Analysis (PCA)?
PCA requires rescaling, such as standardization, because it is sensitive in scale and unit of feature.
PCA is for a continuous variable without labels
PCA generates a smaller number of correlated variables from the high number of variables.
PCA finds a sequence of linear combinations of all features (PCs) in the original matrix that explain the maximal variance, while each PC is mutually uncorrelated.
PCA requires rescaling, such as standardization, because it is sensitive in scale and unit of feature.
PCA is for a continuous variable without labels
PCA generates a smaller number of correlated variables from the high number of variables.
PCA finds a sequence of linear combinations of all features (PCs) in the original matrix that explain the maximal variance, while each PC is mutually uncorrelated.
PCA generates a smaller number of correlated variables from the high number of variables.
19
From 4 variables in the original dataset, we want to reduce the dimension as much as we can while the reduced dimension explains
69% of the total variance. Based on the above PCA table, the dimension should be reduced to ______________ from 4.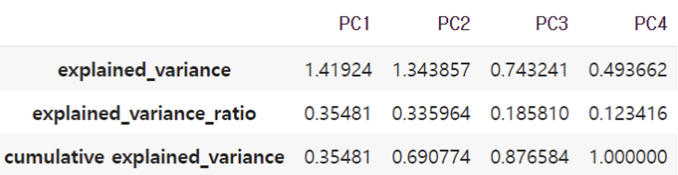
69% of the total variance. Based on the above PCA table, the dimension should be reduced to ______________ from 4.
2
20
In general, unsupervised learning (UL) is widely used for __________________________,
check all that apply
dimension reduction
knowledge discovery
prediction
clustering
check all that apply
dimension reduction
knowledge discovery
prediction
clustering
dimension reduction
knowledge discovery
clustering
knowledge discovery
clustering
21
As can be seen in the above figure, from 100 observations, we find 3 subgroups in the entire samples.
In this case, for clustering, we need _________________.
label only
feature only
hyperparameters
feature and label only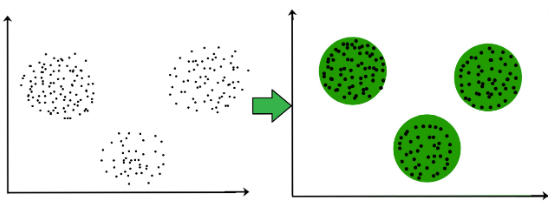
In this case, for clustering, we need _________________.
label only
feature only
hyperparameters
feature and label only
feature only
22
which one in linear regression and which one is PCA?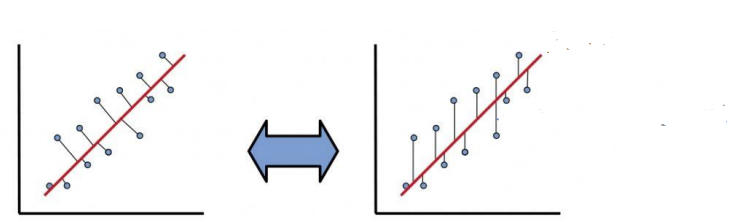
left PCA right linear regression
23
What is PCA used for?
dimensional analysis
24
what does k-means stand for?
clustering
25
what is clustering?
finding subgroups from sample data
26
what is PCA based on?
singular vector decomposition (SVD)
27
what does PCA require since it is sensitive in scale and unit of feature?
rescaling (such as standardization)
28
what kind of variables is PCA for?
continuous variables without labels
29
what does PCA generate?
smaller # of uncorr vars from high # of correlated vars
30
Let's assume a population linear regression as follows:
D= B0 + B1 * P + B2 * Group + u
where D is the aggregated consumer demand
P is the price of the product,
Group variable is a binary dummy variable for consumer segments (1: price inelastic consumer group, 0: price elastic consumer group).
In sample regression, if we cannot observe Group variable; therefore, we run the regression with observable sample data as follows:
D= B0 + B1 * P + E^
In this case, the coefficient for the price variable B1 is______________.
Then, it may be better to apply k-means for sample data to find latent subgroups.
linear unbiased estimator
nonlinear unbiased estimator
linear biased estimator
nonlinear biased estimator
D= B0 + B1 * P + B2 * Group + u
where D is the aggregated consumer demand
P is the price of the product,
Group variable is a binary dummy variable for consumer segments (1: price inelastic consumer group, 0: price elastic consumer group).
In sample regression, if we cannot observe Group variable; therefore, we run the regression with observable sample data as follows:
D= B0 + B1 * P + E^
In this case, the coefficient for the price variable B1 is______________.
Then, it may be better to apply k-means for sample data to find latent subgroups.
linear unbiased estimator
nonlinear unbiased estimator
linear biased estimator
nonlinear biased estimator
linear biased estimator
31
Which ones are true for K-means?
select all that apply
K-means is a method for unlabeled discrete variables
K-means try to assign a cluster for each sample and want to minimize within-cluster variations
K-means does not perform well with the clusters have different sizes, densities, and non-spherical shapes.
K-means need to specify the number of clusters before implementation
select all that apply
K-means is a method for unlabeled discrete variables
K-means try to assign a cluster for each sample and want to minimize within-cluster variations
K-means does not perform well with the clusters have different sizes, densities, and non-spherical shapes.
K-means need to specify the number of clusters before implementation
K-means try to assign a cluster for each sample and want to minimize within-cluster variations
K-means does not perform well with the clusters have different sizes, densities, and non-spherical shapes.
K-means need to specify the number of clusters before implementation
K-means does not perform well with the clusters have different sizes, densities, and non-spherical shapes.
K-means need to specify the number of clusters before implementation
32
what is K-means sensitive to?
initial centroids
33
what does inertia in k-means?
mean square distance between each sample and it's nearest centroid
34
what is a simple, efficient and scalable clustering method?
k-means
35
Which one is not true for K-means?
K-means is sensitive to initial centroids.
Inertia in K-means is the mean square distance between each sample and its nearest centroid.
K-means is a simple, efficient, and scalable clustering method
K-means is a density based method.
K-means is sensitive to initial centroids.
Inertia in K-means is the mean square distance between each sample and its nearest centroid.
K-means is a simple, efficient, and scalable clustering method
K-means is a density based method.
K-means is a density based method.
36
Which one is not true for K-means?
K-means is a method for unlabeled discrete variables
K-means try to assign a cluster for each sample and want to minimize within-cluster variations
K-means does not perform well with the clusters have different sizes, densities, and non-spherical shapes.
K-means need to specify the number of clusters before implementation
K-means is a method for unlabeled discrete variables
K-means try to assign a cluster for each sample and want to minimize within-cluster variations
K-means does not perform well with the clusters have different sizes, densities, and non-spherical shapes.
K-means need to specify the number of clusters before implementation
K-means is a method for unlabeled discrete variables
37
Inertia is the mean square distance between each sample and its nearest centroid.
Overall, the smaller inertia means better performance in K-means.
However, adding more centroids with a larger number of clusters will lower inertia.
As a result, inertia is not a good performance measure when we select the optimal number of clusters.
we use elbow method to select the optimal number of clusters with inertia
Based on the above plot, where the x-axis is a number of clusters, and the y-axis is an inertia for each K-means,
the optimal number of clusters for K-means based on the elbow method is:
5
4
3
2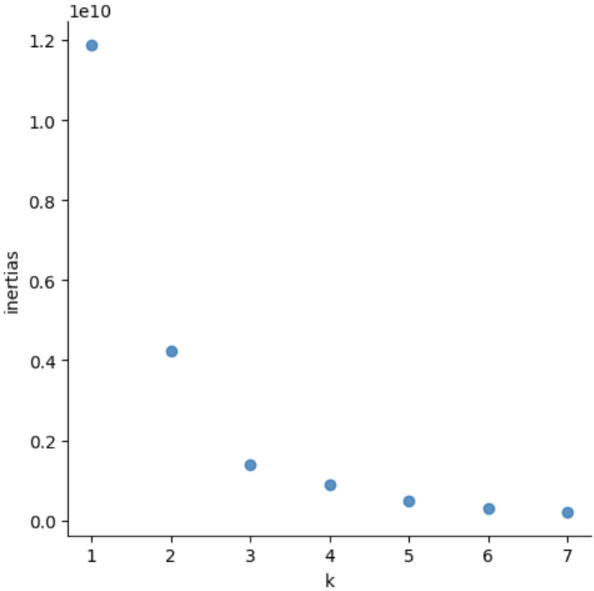
Overall, the smaller inertia means better performance in K-means.
However, adding more centroids with a larger number of clusters will lower inertia.
As a result, inertia is not a good performance measure when we select the optimal number of clusters.
we use elbow method to select the optimal number of clusters with inertia
Based on the above plot, where the x-axis is a number of clusters, and the y-axis is an inertia for each K-means,
the optimal number of clusters for K-means based on the elbow method is:
5
4
3
2
3
38
The above plot is for K-means output with 31 observations with 2 features (X-asix: GDP per capita, Y-axis: Unemployment rate),
Based on the above plot, the number of clusters in this K-means are:
Hint: The black dot is a centroid for each cluster.
3
4
2
5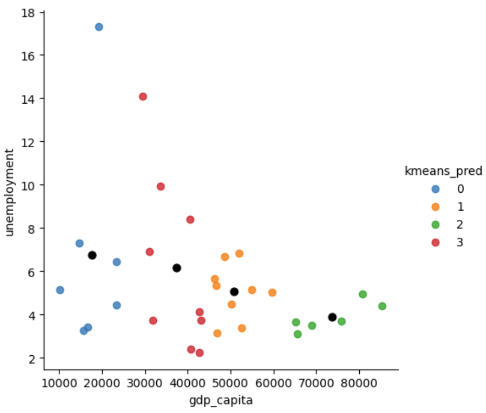
Based on the above plot, the number of clusters in this K-means are:
Hint: The black dot is a centroid for each cluster.
3
4
2
5
4