STEM Unit 8
Study these flashcardsFree · spaced repetition · iPhone, Android, Mac & web
All cards
1
Macroclimate
Macrocimate patterns work at the global, regional, or local level. The changing angle of the sun over the year, bodies of water, and mountains exert seasonal, regional, and local effects on macrodimate.
2
Microclimate
Microclimate is determined by fine-scale variations, such as sunlight and temperature under a log.
3
Chaparral (biome)
Chaparral is dominated by dense, spiny, evergreen shrubs. These are coastal areas with mild rainy winters and long, hot, dry summers. Plants are adapted to fires.
4
Temperate grassland (biome)
Temperate grassland is marked by seasonal drought with occasional fires and by large grazing mammals. All these factors prevent the significant growth of trees. Grassland soil is rich in nutrients, making these areas good for agriculture.
5
Temperate broadleaf (biome)
temperate broadleaf forest is marked by dense deciduous trees that require sufficient moisture. These forests are more open than ( and not as tall as) rainforests. They are stratified- the top layer contains one or two strata of trees; beneath that are shrubs; under that is an herbaceous stratum.
6
Canopy (biome)
Canopy refers to the upper layers of trees in a forest. These trees drop their leaves in fall, and many mammals enter hibernation. Many birds migrate to warmer climates.
7
Coniferous forest (biome)
Coniferous forest is dominated by cone-bearing trees such as pine, spruce, and fir. The conical shape of conifers prevents much snowfall from accumulating on-and breaking-these trees' branches.
8
Tundra (biome)
Tundra is marked by permafrost (permanently frozen layer of soil), very cold temperatures, high winds, and little rainfall. Tundra supports no trees or tall plants. It accounts for about 20% of Earth's terrestrial surface.
9
Tropical Rainforest (biome)
Tropical rain forest has pronounced vertical stratification. The canopy is so dense that little light breaks through. These forests are marked by epiphytes,
which are plants that grow on other plants instead of the soil. Rainfall varies by season but averages 200-400 cm annually. Biodiversity is greatest of all the terrestrial biomes.
which are plants that grow on other plants instead of the soil. Rainfall varies by season but averages 200-400 cm annually. Biodiversity is greatest of all the terrestrial biomes.
10
Photic zone
includes the upper layer of water in which there is enough light for photosynthesis to occur
11
aphotic zone
is characterized by very low light penetration.
12
Oligotrophic lakes
Oligotrophic lakes are deep lakes that are nutrient-poor and oxygenrich and contain sparse phytoplankton.
13
Eutrophic lakes
Eutrophic lakes are shallower, and they have higher nutrient content and lower oxygen content with a high concentration of phytoplankton.
14
Estuaries
Estuaries are areas where freshwater streams or rivers merge with the ocean. Estuaries are among the most productive habitats on Earth.
15
Clumped dispersion
The most common pattern of dispersion is clumped, with individuals in patches, usually around a required resource. Example: cottonwood trees along a stream in the arid Southwest.
16
uniform dispersion
A uniform dispersion pattern is often the result of antagonistic interactions. Animals that defend territories often show a uniform pattern. Example: red-winged blackbirds during mating season.
17
random dispersion
Random dispersion shows unpredictable spacing. This is not a common spacing in nature because there is usually a reason for a pattern of spacing.
18
exponential population growth equation
Exponential population growth is shown by the equation dN/ dt = r maxN. In this equation, dN is the size of the population at a particular instant in time; dt is the time interval involved in the calculation; r max is the maximum per capita rate of increase for the species under study; N is the population size.
19
Carrying capacity
The carrying capacity of a population is defined as the maximum population size that a certain environment can support at a particular time with no habitat degradation.
20
K-selection
Selection of life history traits that are sensitive to population density and carrying capacity are known as K-selection. K-selection operates in populations living close to the density imposed by the carrying capacity.
21
r-selection
selection for life history traits that maximize reproductive success is called r-selection.
22
what types of graphs are r-selection and k-selection
The logistic growth model is sometimes associated with K-selection, whereas the exponential growth model is often associated with r-selection.
Both K-selection and r-selection are two ends of a continuum of life history strategies.
Both K-selection and r-selection are two ends of a continuum of life history strategies.
23
Density-dependent factors on birth rate and death rate
competition for resources, territoritality, and disease
24
Density-independent factors
When a death rate does not change with increase in population density, it is said to be density independent. Natural disasters are examples of densityindependent factors
25
Demographic transition
Demographic transition occurs when a population goes from high birth rates and high death rates to low birth rates and low death rates. Demographic transition may regularly take 150 years to complete.
26
ecological footprint
ecological footprint examines the total land and water area needed for all the resources a person consumes in a population. Currently, 1.7 hectares per
person is considered sustainable. A typical person in the United States has a footprint of 10 hectares.
person is considered sustainable. A typical person in the United States has a footprint of 10 hectares.
27
the competition exclusion principle
The competitive exclusion principle states that when two species are vying for a resource, eventually the one with the slight reproductive advantage will eliminate the other.
28
ecological niche
An organism's ecological niche is the sum total of biotic and abiotic resources that the species uses in its environment.
29
Cryptic coloration
Cryptic coloration, in which the animal is camouflaged by its coloring.
30
Aposematic coloration
Aposematic, or warning coloration, in which a poisonous animal is brightly colored as a warning to other animals.
31
Batesian and Millerian mimicry
Batesian mimicry refers to a situation in which a harmless species has evolved to mimic the coloration of an unpalatable or harmful species.
In Miillerian mimicry, two bad-tasting species resemble each other ostensibly so that predators will learn to avoid them equally.
In Miillerian mimicry, two bad-tasting species resemble each other ostensibly so that predators will learn to avoid them equally.
32
keystone species
Keystone species exert control on community structure by their important ecological niche.
33
ecological succession
Ecological succession refers to transitions in species composition in a certain area over ecological time.
34
primary succession
In primary succession, plants and animals gradually invade a region that was virtually lifeless where soil has not yet formed.
The gradual colonization of a newly formed volcanic island would be an example.
The gradual colonization of a newly formed volcanic island would be an example.
35
Secondary succession
Secondary succession occurs when an existing community has been cleared by a disturbance that leaves the soil intact.
An abandoned farm will show secondary succession as it starts with the soil intact.
An abandoned farm will show secondary succession as it starts with the soil intact.
36
These two biogeographic contributions are especially important in community diversity:
The latitude of the community. Plant and animal life is generally more abundant and diverse in the tropics, becoming less so moving toward the poles.
The area of the community. If all other factors are held equal, the larger the geographic area of a community, the more species it has.
The area of the community. If all other factors are held equal, the larger the geographic area of a community, the more species it has.
37
Island biogeography is primarily influenced by two factors:
Rates of immigration and extinction are influenced primarily by the size of the island and the distance of the island from the mainland. The greater the size of the island, the higher immigration rates will be and the lower the rates of extinction.
As the distance from the mainland increases, the rate of immigration falls, whereas extinction rates increase.
As the distance from the mainland increases, the rate of immigration falls, whereas extinction rates increase.
38
gross primary production (GPP)
Total primary production in an ecosystem is known as that system's gross primary production (GPP).
39
Net primary production (NPP) is equal to gross primary production minus the energy used by the primary producers for their "autotrophic respiration" (Ra):
- NPP = GPP-Ra
- NPP = GPP-Ra
40
How much energy is transferred throughout the levels of the food chain?
10%
41
biochemical cycles
Biogeochemical cycles are nutrient cycles that contain both biotic and abiotic components. Understanding these cycles allows scientists to trace how nutrients flow through ecosystems and how humans may have altered the flow
42
carbon cycle
The carbon cycle has historically been a close balance between the amount of CO2 removed from ecosystems by photosynthesis and added by cellular respiration. The burning of fossil fuels has added significant amounts of additional CO2 to the atmosphere.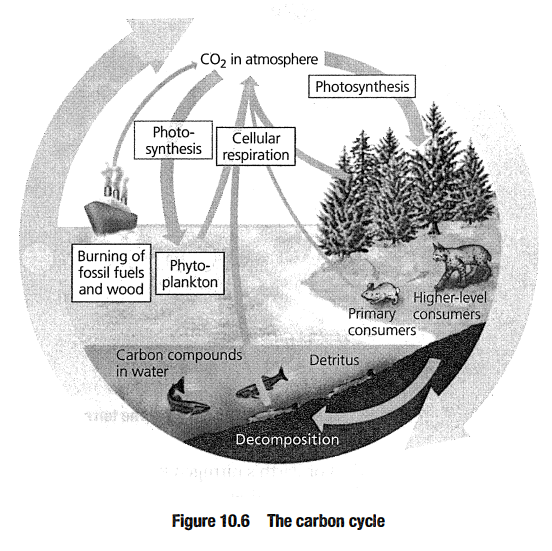
43
nitrogen cycle
The nitrogen cycle moves nitrogen from the· atmosphere through the living world. Nitrogen is a common limiting factor for plant growth, making its movement through ecosystems especially important.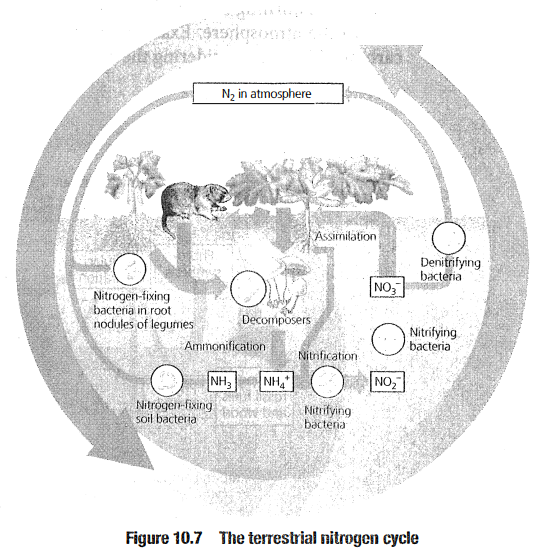
44
nitrogen fixation
nitrogen fixation, the conversion of N2 by bacteria to forms that can be used by plants.
45
Nitrification
Nitrification is the process by which ammonium (NH4 +) is oxidized to nitrite and then nitrate (N03 -) by bacteria. Two inorganic nitrogen forms can be absorbed by plants:
- nitrates and ammonium.
- nitrates and ammonium.
46
Denitrification
Denitrification by bacteria releases nitrogen to the atmosphere.
47
Bioremediation uses organisms, usually, prokaryotes, fungi, or plants, to detoxify polluted ecosystems. It has been used to restore areas degraded by mining or to remove oil or radioactive elements.
48
Bioaugmentation
Bioaugmentation is the introduction of desirable species such as nitrogen fixers to add essential nutrients.
49
What happens when a population drops below a minimum viable population (MVP) size
its loss of genetic variation due to nonrandom mating and genetic drift can trap it in an extinction vortex. One key factor is the loss of genetic variation necessary to enable evolutionary responses to environmental change, such as the appearance of new strains of pathogens.
50
Acid precipitation
Acid precipitation is defined as rain, snow, or fog with a pH of less than 5.2. Burning wood and fossil fuels release sulfur and nitrogen oxides into the atmosphere. These oxides react with water, forming sulfuric acid and nitric acid.