energetics y1 + how fast y2 (rates of reactions)
Study these flashcardsFree · spaced repetition · iPhone, Android, Mac & web
All cards
1
Define rate of reaction.
Change in concentration of reactant or product per unit time.
2
What are the usual units of reaction rate?
mol dm⁻³ s⁻¹
3
How is rate calculated from a concentration–time graph?
Gradient of a tangent; use its magnitude for reactant disappearance.
4
How do you determine initial rate from a graph?
Draw a tangent at t = 0 and calculate its gradient.
5
Why is a reaction often fastest initially?
Reactant concentrations are highest, giving more frequent successful collisions.
6
What happens to reaction rate as reactants are consumed?
It usually decreases as concentrations and collision frequency fall.
7
Define activation energy.
Minimum energy required for a collision to result in a reaction.
8
State the two requirements for a successful collision.
Sufficient energy (≥ Ea) and appropriate orientation.
9
How does increased concentration affect reaction rate?
More particles per unit volume; more frequent successful collisions.
10
How does increasing gas pressure affect reaction rate?
Greater gas concentration produces more frequent collisions.
11
Why does a powdered solid usually react faster?
Greater exposed surface area increases collision frequency.
12
How does a catalyst increase reaction rate?
Provides an alternative reaction pathway with lower activation energy.
13
Does a catalyst change the enthalpy change of reaction?
No. It changes the pathway, not the initial and final energy levels.
14
Does a catalyst change the equilibrium position?
No. It speeds up forward and reverse reactions without changing K.
15
Why does increasing temperature increase reaction rate?
More molecules have energy ≥ Ea, increasing successful collisions.
16
Why can a small temperature rise greatly increase rate?
The fraction of molecules with energy ≥ Ea rises significantly.
17
What are the axes of a Maxwell–Boltzmann graph?
x: molecular energy; y: number or fraction of molecules.
18
How does the Maxwell–Boltzmann curve change at higher T?
Peak lower and rightward; broader curve; same total area.
19
Why is the area under both Maxwell–Boltzmann curves equal?
The total number of molecules remains unchanged.
20
How is activation energy shown on a Maxwell–Boltzmann graph?
Vertical line at Ea; area to its right represents molecules with E ≥ Ea.
21
How does a catalyst affect a Maxwell–Boltzmann diagram?
Distribution unchanged; the activation-energy threshold shifts left.
22
Define rate equation.
Experimentally determined relationship between rate and reactant concentrations.
23
Write the general rate equation for A and B.
rate = k[A]ᵐ[B]ⁿ
24
What do the powers in a rate equation represent?
Orders of reaction with respect to individual reactants.
25
Define overall order of reaction.
Sum of the powers of concentration terms in the rate equation.
26
Can orders be deduced from balanced equation coefficients?
Generally no; orders must be determined experimentally.
27
Define zero order with respect to A.
Changing [A] does not affect rate when other conditions are constant.
28
Define first order with respect to A.
Rate is directly proportional to [A].
29
Define second order with respect to A.
Rate is directly proportional to [A]².
30
What happens to rate when a zero-order reactant doubles?
No change: ×1.
31
What happens to rate when a first-order reactant doubles?
Rate doubles: ×2.
32
What happens to rate when a second-order reactant doubles?
Rate quadruples: ×4.
33
What happens to rate when a second-order reactant triples?
Rate increases ninefold: ×9.
34
What happens if a second-order reactant is halved?
Rate becomes one-quarter: ×¼.
35
How do you deduce order from two experiments?
Compare rate changes when only one reactant concentration changes.
36
How do you determine orders when two concentrations change?
Use known orders or compare rate ratios to isolate the unknown order.
37
What is the rate multiplier for rate = k[A][B]² if both double?
2 × 2² = 8.
38
What is the multiplier if [A] halves and [B] triples in k[A]²[B]?
(½)² × 3 = ¾.
39
How do you calculate k from a rate equation?
Rearrange: k = rate divided by the product of concentration terms.
40
What are the units of k for a zero-order reaction?
mol dm⁻³ s⁻¹
41
What are the units of k for a first-order reaction?
s⁻¹
42
What are the units of k for a second-order reaction?
dm³ mol⁻¹ s⁻¹
43
What are the units of k for a third-order reaction?
dm⁶ mol⁻² s⁻¹
44
What is the general formula for units of k, overall order n?
(mol dm⁻³)^(1−n) s⁻¹
45
How do you derive units of k reliably?
Divide rate units by the concentration units raised to each order.
46
Does changing concentration change k at constant temperature?
No. Concentration changes rate, not k.
47
What happens to k when temperature increases?
k generally increases according to the Arrhenius equation.
48
How does a catalyst affect k?
It increases k by lowering the activation energy.
49
What does a horizontal rate–concentration graph indicate?
Zero order.
50
What does a straight rate–concentration line through the origin indicate?
First order.
51
What does an upward-curving rate–concentration graph indicate?
Second order, if rate is proportional to concentration squared.
52
How can plotting rate against [A]² establish second order?
A straight line through the origin supports rate ∝ [A]².
53
What is a concentration–time graph for zero-order consumption?
Straight-line decrease with constant negative gradient.
54
What is a concentration–time graph for first-order consumption?
Exponential decay with decreasing magnitude of gradient.
55
How can half-life identify a first-order reaction?
Successive half-lives are constant.
56
Define half-life.
Time taken for reactant concentration to decrease to half its value.
57
What is the first-order half-life equation?
t½ = ln 2 / k
58
How many half-lives leave 12.5% of reactant?
Three half-lives.
59
What is the integrated first-order rate equation?
ln[A]ₜ = ln[A]₀ − kt
60
Which first-order graph gives a straight line with gradient −k?
ln[A] against time.
61
How does half-life change in a zero-order reaction?
Successive half-lives decrease.
62
How does half-life change in a second-order reaction?
Successive half-lives increase.
63
What is the integrated zero-order rate equation?
[A]ₜ = [A]₀ − kt
64
What is the integrated second-order equation for one reactant?
1/[A]ₜ = 1/[A]₀ + kt
65
Which graph is linear for second-order consumption of A?
1/[A] against time; gradient +k.
66
What is the purpose of the initial-rates method?
Determine reaction orders using rates measured before significant concentration changes.
67
Why must initial-rate experiments use the same temperature?
Temperature affects k, which would confound concentration comparisons.
68
Why is the total volume kept constant across mixtures?
To control dilution and concentrations of unchanged reactants.
69
How is concentration calculated after dilution?
c₂ = c₁V₁/V₂
70
What is the purpose of adding water to different reaction mixtures?
Maintain equal total volumes while varying a selected reactant concentration.
71
Why use a large excess of one reactant?
Its concentration remains approximately constant, giving pseudo-order kinetics.
72
Does excess reactant prove its true order is zero?
No. Its concentration is effectively constant only under those conditions.
73
What is the relationship between rate and time for a fixed amount of product?
Rate is proportional to 1/t, if the same amount forms each time.
74
How can gas evolution be monitored continuously?
Measure gas volume against time using a gas syringe.
75
When is a mass-loss experiment suitable?
When a gaseous product escapes from the reaction vessel.
76
When is colorimetry useful for rate measurements?
When a coloured species changes concentration during the reaction.
77
How can iodine concentration be measured during a reaction?
Titrate timed samples with standard sodium thiosulfate solution.
78
Why quench a reaction mixture before titration?
Stop or greatly slow further reaction so measured composition is preserved.
79
What happens to iodine colour as it is consumed?
Brown/yellow colour fades as iodine concentration falls.
80
How is the initial rate obtained from a gas-volume graph?
Gradient of the tangent at t = 0; units such as cm³ s⁻¹.
81
What does a plateau on a product-volume graph indicate?
No further measurable product forms; reaction has effectively finished.
82
What is a rate-determining step?
The slow step controlling the overall reaction rate.
83
How can a rate equation help identify a slow step?
It constrains the reactant dependence of a consistent mechanism.
84
Can an intermediate appear in an elementary slow step?
Yes; its concentration may need expressing using preceding equilibria.
85
What is an intermediate?
Species formed in one step and consumed in another; absent from overall equation.
86
How is a catalyst distinguished from an intermediate?
Catalyst is consumed then regenerated; intermediate is formed then consumed.
87
Why can a reactant have zero order despite appearing in the equation?
It may not affect the rate-controlling process.
88
What does rate = k[propanone][H⁺] imply about iodine order?
Iodine is zero order.
89
What happens to iodine/propanone rate if [I₂] doubles?
No change, at constant propanone and acid concentrations.
90
What does the Arrhenius equation state?
k = Ae^(−Ea/RT)
91
What is A in the Arrhenius equation?
Pre-exponential or frequency factor; same units as k.
92
What is the logarithmic Arrhenius equation?
ln k = −Ea/(RT) + ln A
93
What are the axes of an Arrhenius plot?
y: ln k; x: 1/T in K⁻¹.
94
What is the gradient of an Arrhenius plot?
−Ea/R
95
How is Ea calculated from an Arrhenius gradient?
Ea = −gradient × R; divide by 1000 for kJ mol⁻¹.
96
What is the y-intercept of ln k against 1/T?
ln A; therefore A = e^(intercept).
97
Why must T be converted to kelvin?
Arrhenius calculations require absolute temperature.
98
How can Ea be found from two k values?
ln(k₂/k₁) = (Ea/R)(1/T₁ − 1/T₂).
99
How is an Arrhenius plot constructed from fixed-time measurements?
Plot ln(1/t) against 1/T when k ∝ 1/t.
100
Why is the Arrhenius graph's gradient negative?
As 1/T increases, temperature and k decrease.
101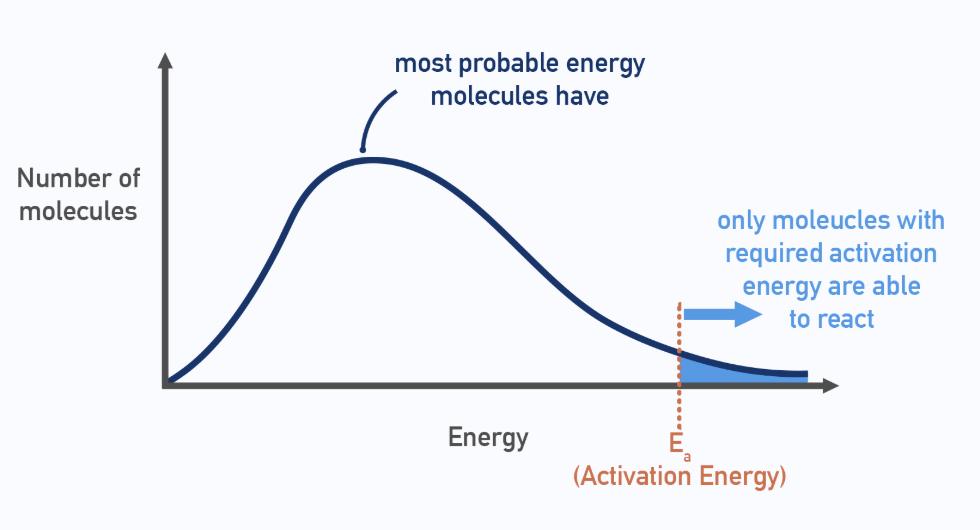
Draw the Maxwell–Boltzmann distribution graph at a constant temperature.
102
Draw the Maxwell–Boltzmann distribution showing the effect of increasing temperature.
103
Draw the Maxwell–Boltzmann distribution showing the effect of adding a catalyst.
104
Draw an exothermic enthalpy profile diagram with and without a catalyst.
105
Draw an endothermic enthalpy profile diagram with and without a catalyst.
106
Draw the concentration–time graph for a zero-order reaction.
107
Draw the concentration–time graph for a first-order reaction, showing constant half-life.
108
Draw the concentration–time graph for a second-order reaction.
109
Draw the rate–concentration graph for a zero-order reaction.
110
Draw the rate–concentration graph for a first-order reaction.
111
Draw the rate–concentration graph for a second-order reaction.
112
Draw an Arrhenius plot of ln k against 1/T, labelling the gradient and y-intercept.
113
Draw a concentration–time graph showing how to determine initial and instantaneous rates using tangents.