Biostats Exam 1
Study these flashcardsFree · spaced repetition · iPhone, Android, Mac & web
All cards
1
4 steps of making a hypothesis
1. Make hypothesis
• 2. Set criteria for decision
• 3. Gather data and conduct statistical analysis
• 4. Make decisions
• 2. Set criteria for decision
• 3. Gather data and conduct statistical analysis
• 4. Make decisions
2
no difference hypothesis
null hypotesis H0
3
at least one sample is different from the population hypothesis, Ha
alternatve hypothesis
4
chance; likelihood an event will occur
probability
5
probability: only one event can occur; either/or
mutually exclusive
6
probability: eithr event could occur
independent
7
what rule is used when calculating mutiually exclusive events probability
additive rule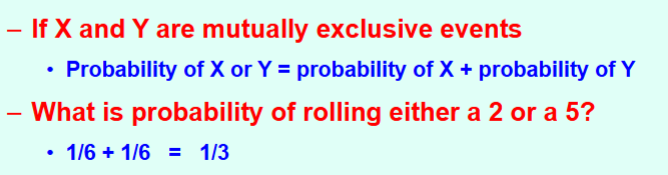
8
what rule is used to calculate probability of indepemdemt events
multiplicative rule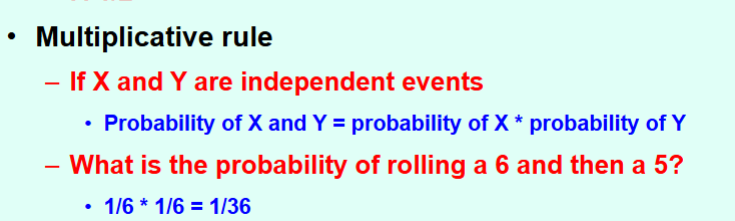
9
Selection of study subjects who will be
measured on some parameter to provide
information about population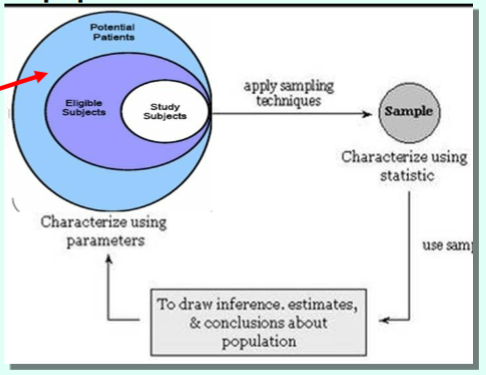
measured on some parameter to provide
information about population
sampling
10
Each individual has equal chance
of being selected
• Draw out of a hat
of being selected
• Draw out of a hat
random sampling
11
select at regular intervals thrpugh ordered list
systematic sampling
12
seperate populations into strata based on a characteristic; randomly select proprtion of participants from each stratum
stratified sampling
13
populations aee already in a strata and you randpomly select groups of strata
cluster sampling
14
cold call sampling
comvenience sampling
15
combines 1 or mpre sampling methods
multistage sampling
16
categprical variables that are groups or cohorts, can be nominal, dichotomous, or ordinal
qualitative variables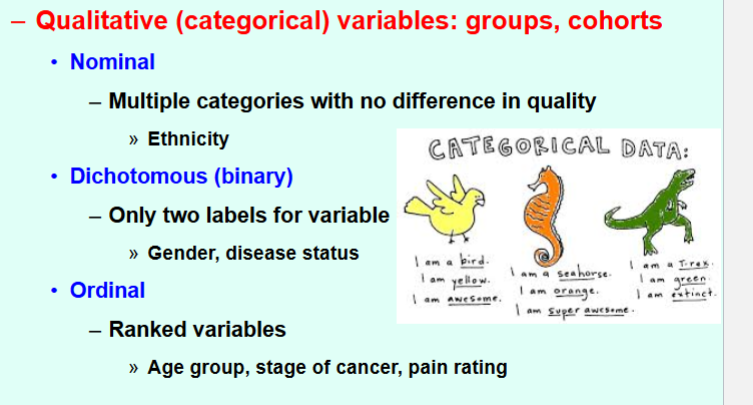
17
measured quantities, continuous, intervals or ratios
quantitative variable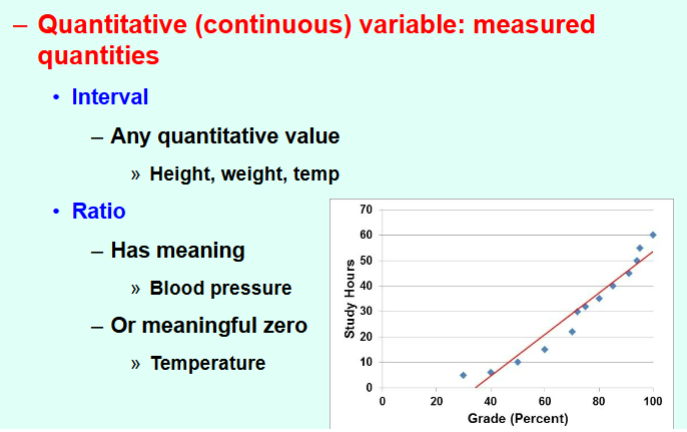
18
types of descriptive statistics (x5)
sample size, measures of central tendency, measures of dispersion, confidence intervals, power and errors
19
what measures central tendency? (x3)
mean median mode
20
what measures dispersion (4)
range, interquartile range, percentiles, standard deviation
21
Describes data without generalizing population
– Needed to determine which statistical test to use
– Needed to determine which statistical test to use
descriptive statistics
22
what is used to mesure/test descriptive statistics
central tendency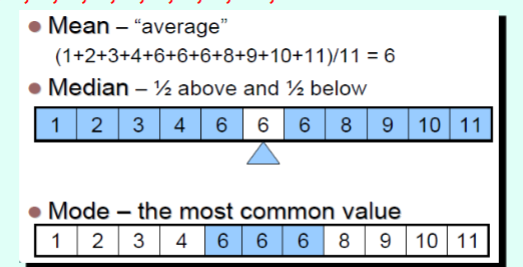
23
spread of data
variance
24
difference between the 25th and 75th percentiles
interquartile ramnge
25
square root of variance
standard deviation
26
what is the standard error equation
SD/sqrt sample size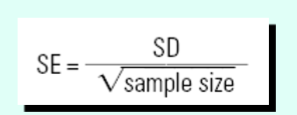
27
how do you reduce variance (x3)
increase sample size, better define our sample population, censor outliers
28
types of distribution (x2)
unimodal: normal and skewed
bimodal: population statistics
bimodal: population statistics
29
bell shaped curve for continuance variables
normal distribution
30
in a normal distribution, mean or u=?
median
31
what is the mean median mode relationship in a positive skew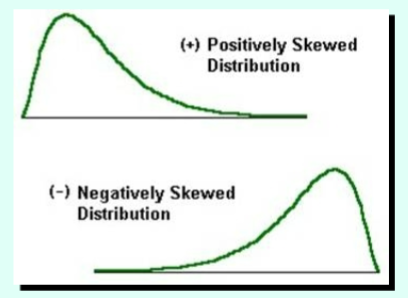
mean>median>mode
32
what is the mean medoan mode relationship in a negative skew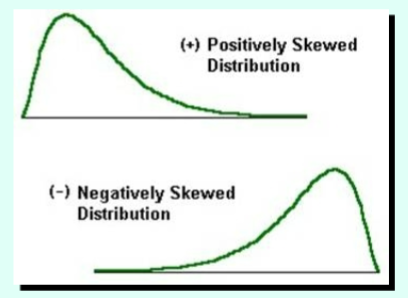
mean<median<mode
33
95% probability that population mean lies within interval
95% confidence interval
34
probability of rejecting H0 when it is true
type 1 (a) error
35
probabilkiuty of accepting H0 when it is false
Type II (B) error
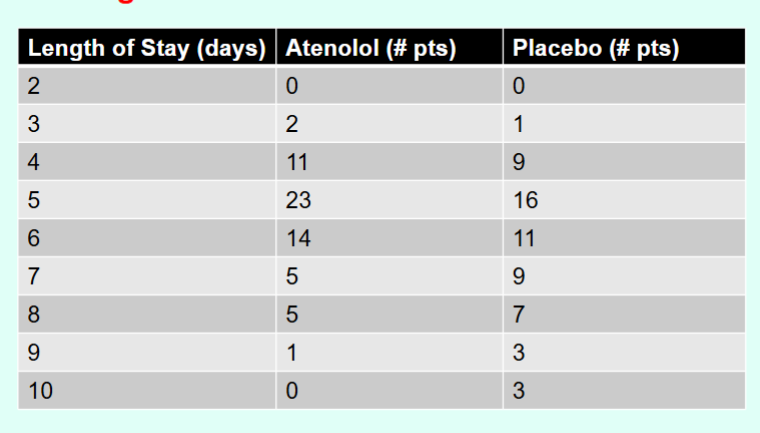
36
what is the equation of power?
Power=1-B
37
what is power
probability of not commiting type II error
38
what are the two ways to test catagorical data
X2 or fisher's exact
39
recruit study gfroup and define at leats 2 categories
cross-sectipnal study
40
recruit groups with some differences and follow them
prospective study
41
start with a condition and look baclwards at potential causes
retrospective study
42
recruit groups ans manipulate variables
experimental study
43
positive or negative resulkts study
diagnostic test
44
how do you calculate degrees of fredom in x2
n-1 or (rows-1) x (columns-1)
45
what test do you use with categorical data that has numbers in groups bellow 5
fisher's exact
46
indepent data test for 2 groups thats continuous
t test (para)
mann whitney U (nonpara)
mann whitney U (nonpara)
47
dependant data test for 2 groups thats continuous
paired t test (para)
wilcoxon (nonpara)
wilcoxon (nonpara)
48
continuous data test for >2 groups
anova (para)
kruskal wallis (non para)
kruskal wallis (non para)
49
requirements for t test
continuous data and random sample
50
assumptions for student t tests
Each of the 2 populations being compared is
**normally distributed**.
2. Each of the 2 populations should have the
same variance.
**normally distributed**.
2. Each of the 2 populations should have the
same variance.
51
compare a groups means to benchmark (known) t test
one sample t tests
52
compare 2 independant groups t test
independant t tests
53
population B is signif different from pop A: one tailed or two
2 tailed
54
population b is significantly > than pop a: 1 or 2 tailed
1 tailed
55
Used to compare means of 3 or more groups
Using multiple t tests for permutations of comparisons compounds
Type 1 error!
1. Compares all groups at once
a.Tells you there is a difference between at least 2 groups
Using multiple t tests for permutations of comparisons compounds
Type 1 error!
1. Compares all groups at once
a.Tells you there is a difference between at least 2 groups
ANOVA
56
assumptions for anova (x3)
Independent observations
Normally distributed data
Homogeneity of variance [Levene’s Test]
Normally distributed data
Homogeneity of variance [Levene’s Test]
57
identifies the specifc groups that are different test (ANOVA)
anova post hoc
58
what are the types of anova post hoc tests?
tukey: compare each group to every other group
Dunnett's: compare all groups to control group
Dunnett's: compare all groups to control group
59
what are the two tests for continuous variables that are categorical and indepoendent
pearson correlation and spearman's rank
60
larger association is more likely to causal effect
strength
61
stonger associations when same findings observed by different people and different samples
consistency
62
specific populations or ris factors with spoecific disease and no other likely explination
specificity
63
effect happens after the cause
temporalityt
64
more exposure=greater incidence
biological gradient
65
plasible mechanism between cause and effect helpful
plausibility
66
link between epidemulogicalk and lab findings increases likelihood
coherence
67
ocassionally it is posibe to appeal to expefimental evidence
experiment
68
effect of similar factpors may be considered
analogy
69
measure linear relationship between 2 variables, between -1 and 1
r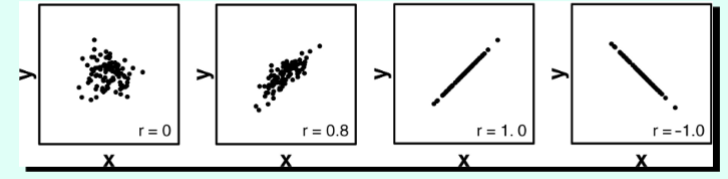
70
coefficient of determination that indicates how well data fits a statisical model
R2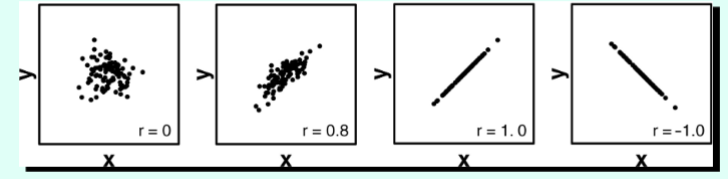
71
Measures extent to which, as one variable
increases, other variable tends to increase
increases, other variable tends to increase
rho
72
Used to analyze data in which time until event is
of interest
usually time until death
of interest
usually time until death
survival analysis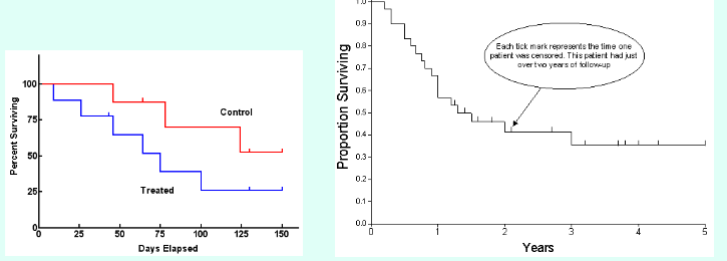
73
Sample is not representative of population
• Berkson bias: disease prevalence estimated from hospital
records
• Berkson bias: disease prevalence estimated from hospital
records
selection bias
74
Hawthorne effect
• Participant behavior altered by knowing they are being
studied
• Participant behavior altered by knowing they are being
studied
measurement bias
75
Expected results accidently communicated to
participants
participants
experimenter bias/pygmalion effect
76
False estimate of survival rates
• Patients appear to survive longer after new screening test
• Patients appear to survive longer after new screening test
lead-time bias
77
Participants do not accurately recall events
• Issue in retrospective studies
• Issue in retrospective studies
recall bias
78
Participants with severe disease less likely to be
identified because they die first
identified because they die first
late-look bias
79
A factor in a study is related to co-factor being
examined
• Incidence of cancer in 2 groups where one group is
younger
examined
• Incidence of cancer in 2 groups where one group is
younger
confoundig bias
80
Choosing inappropriate study design to answer
question
question
design bias
81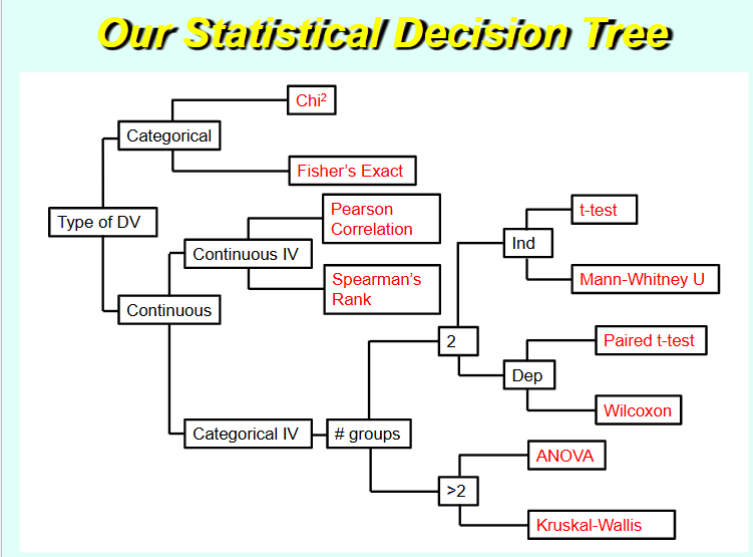
Image occlusion: name the hidden labels
82
Image occlusion: name the hidden labels
83
Image occlusion: name the hidden labels
84
Image occlusion: name the hidden labels
85
Image occlusion: name the hidden labels
86
Measure of new cases of disease or injury in
population over specified time period
• Example: 147 new cases of Lyme disease reported to
Erie County Department of Health in 2021
population over specified time period
• Example: 147 new cases of Lyme disease reported to
Erie County Department of Health in 2021
incidence
87
Measure of total number of cases of disease or
injury in population over specified time period
• Example: 40 students absent from class today due to
influenza
injury in population over specified time period
• Example: 40 students absent from class today due to
influenza
prevalence
88
Test detects what it was designed to test
• Does it measure what it was intended to measure?
• Does it measure what it was intended to measure?
validity
89
are the results of the test valid to experimentak samples
internal validity
90
can results be generalized to population
external validity
91
no random variation; dependabiluty
-does test provide the same value over repeated attemps
PRECISION
-does test provide the same value over repeated attemps
PRECISION
reliability
92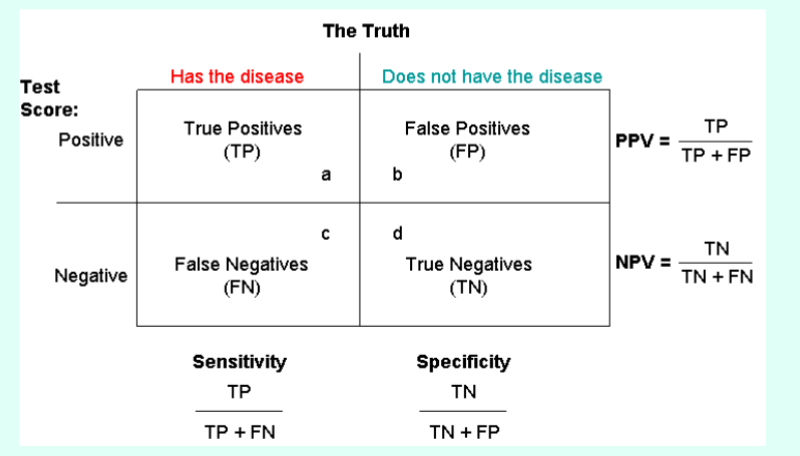
Image occlusion: name the hidden labels
93
Image occlusion: name the hidden labels
94
Image occlusion: name the hidden labels
95
Image occlusion: name the hidden labels
96
Image occlusion: name the hidden labels
97
Image occlusion: name the hidden labels
98
Image occlusion: name the hidden labels
99
Image occlusion: name the hidden labels
100
sensitivity equation
TP/(TP+FN)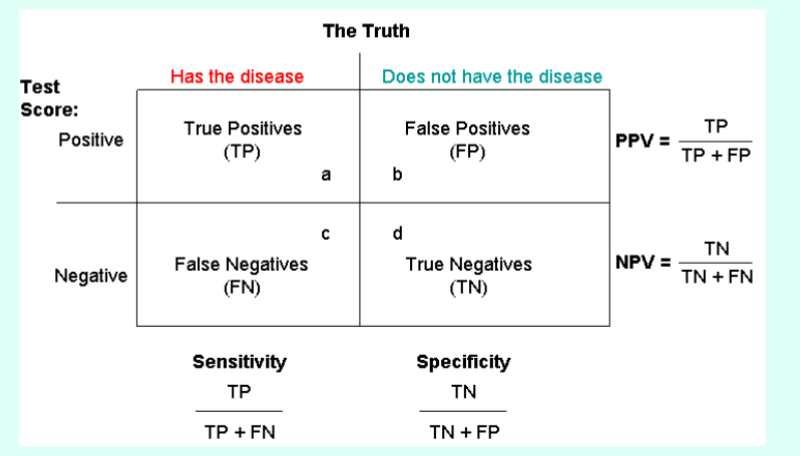
101
specificity equation
TN/(TN+FP)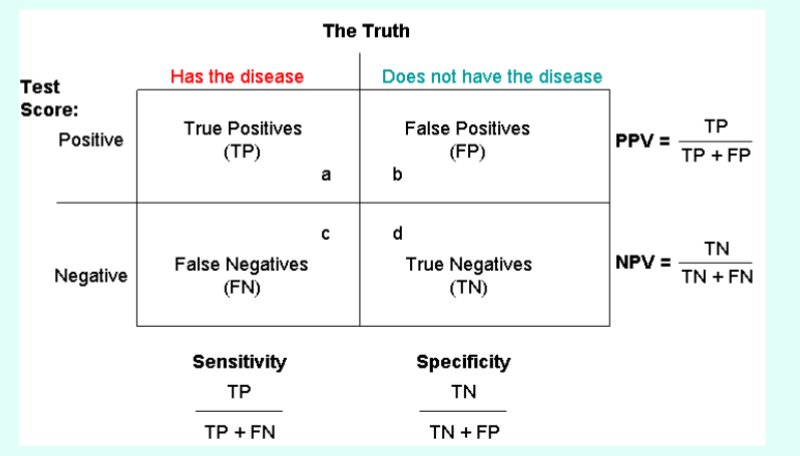
102
PPV equation
TP/(TP+FP)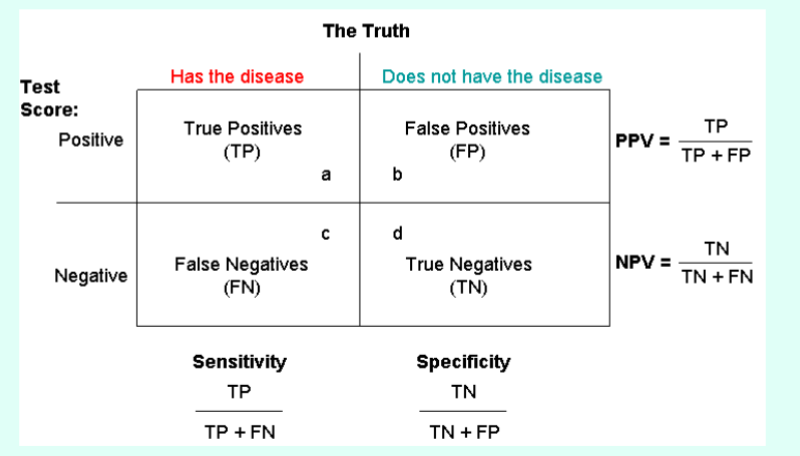
103
NPV equation
TN/(TN+FN)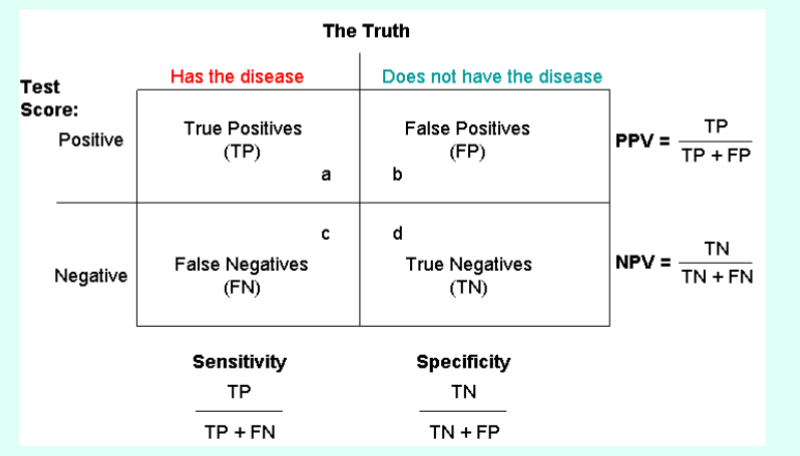
104
Proportion of pts with disease where screening test
is positive
• Probability that pt tests positive if disease is present
is positive
• Probability that pt tests positive if disease is present
sensitivity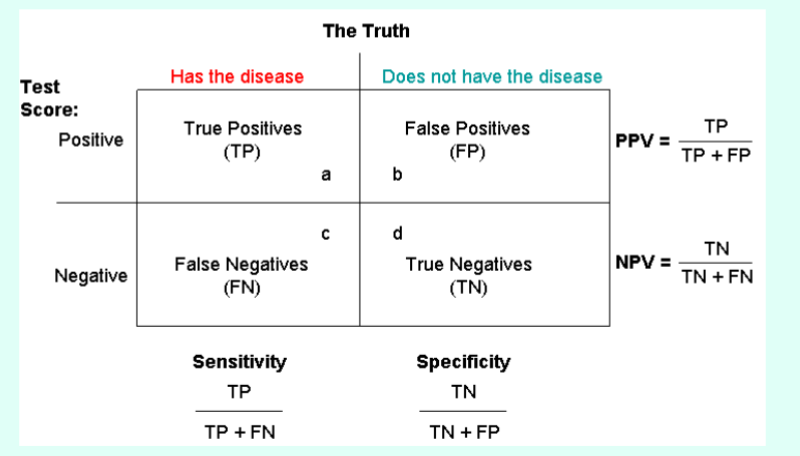
105
the _____ sensitivity, the better the test is in finding diseased patients
greater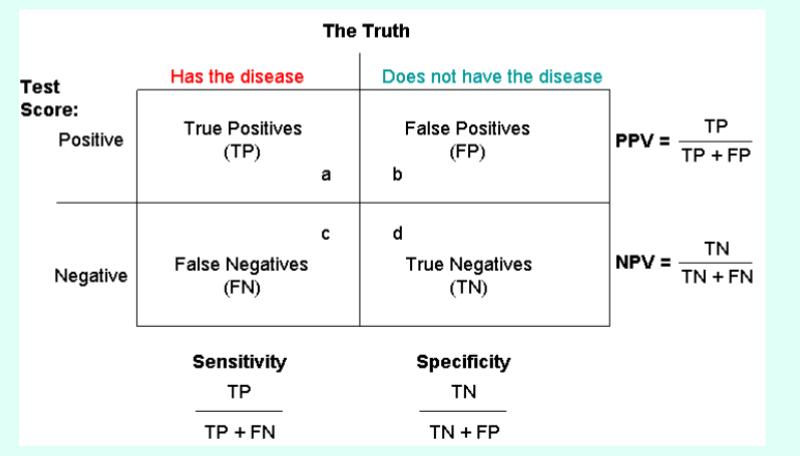
106
Proportion of pts without disease where screening
test is negative
• Probability that pt tests negative if disease is NOT present
test is negative
• Probability that pt tests negative if disease is NOT present
specificity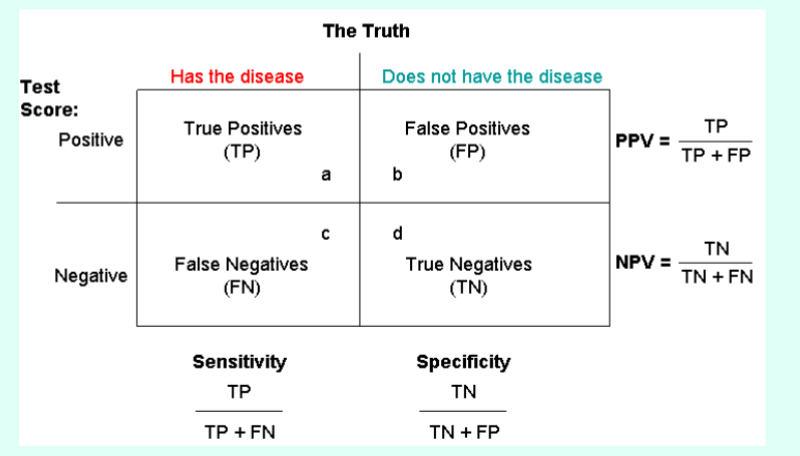
107
the ______ specificity, the greater likelihood healthy people arent diagnosed diseased
greater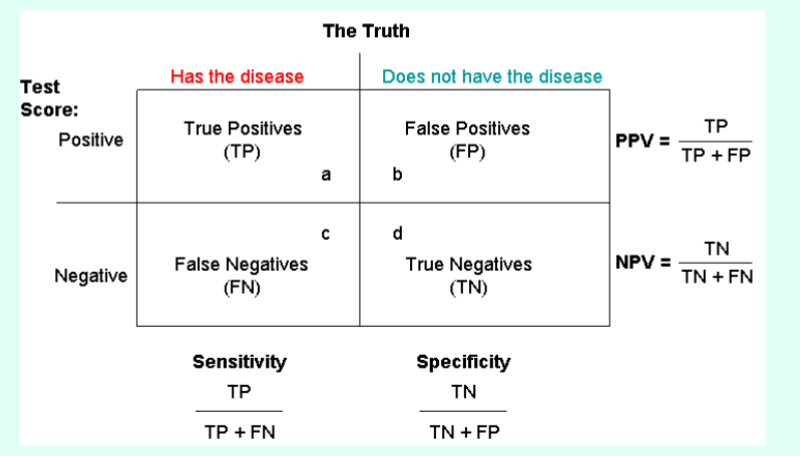
108
Proportion of positive test results where pts are
diseased
• Probability pt has disease if test is positive
diseased
• Probability pt has disease if test is positive
positive predictive value (PPV)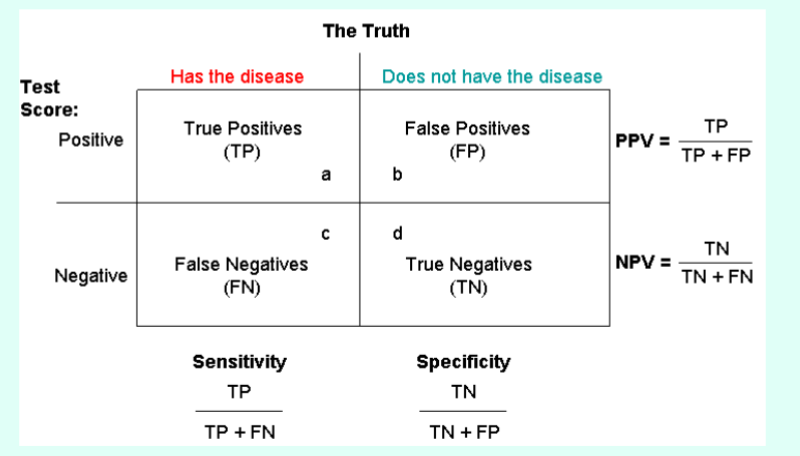
109
Proportion of negative test results where pts are
not diseased
• Probability pt does NOT have disease if test is negative
not diseased
• Probability pt does NOT have disease if test is negative
negative predictive value (NPV)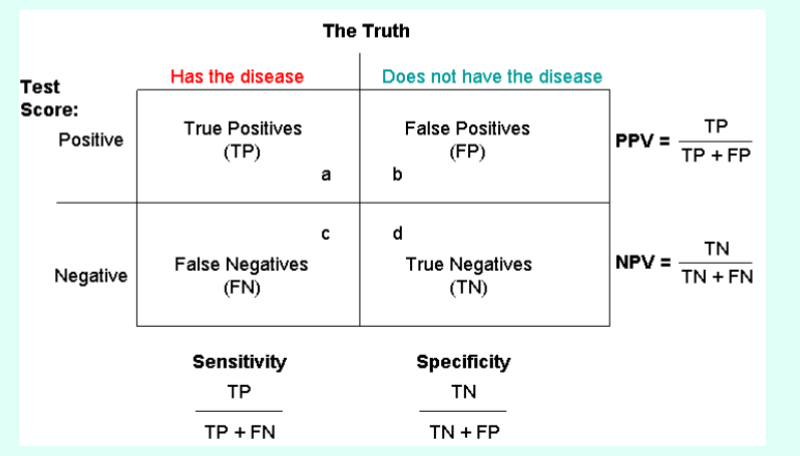
110
what cjanges if incidence/prevalence increases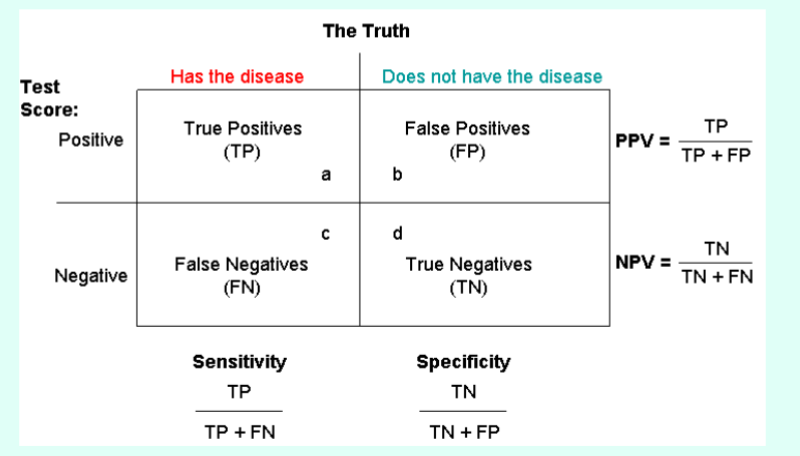
PPV increases, NPV decreases, sensitivity and specificty dont change
111
what changes if there is a lower incidence prevalnece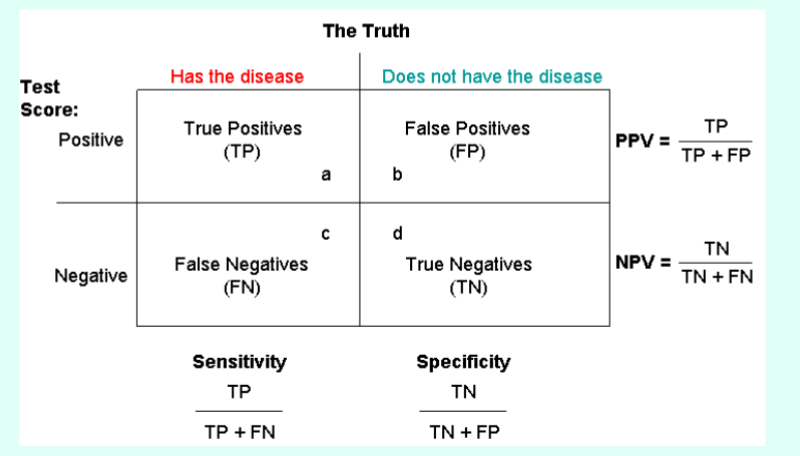
PPv decreases, NPV increases, sensitivity and specficity the same
112
Looks for disease as it develops
– Start with population at risk
– Measure risk factor as it occurs
– Start with population at risk
– Measure risk factor as it occurs
Cohort study
113
Looks for risk factor in past
– Start with cases
– Select appropriate controls
– Analyze if “risk” factor more common in cases than
controls
– Start with cases
– Select appropriate controls
– Analyze if “risk” factor more common in cases than
controls
case control study
114
Probability of developing a disease over a time-period
– Difference in outcomes with and without a risk factor
» Cohort studies, prospective in design
– Difference in outcomes with and without a risk factor
» Cohort studies, prospective in design
relatve risk
115
Probability that event will occur divided by probability that
event will not occur
– Difference in presence of risk factor in those with and
without a condition
» Case-control studies, retrospective in design
event will not occur
– Difference in presence of risk factor in those with and
without a condition
» Case-control studies, retrospective in design
odds ratio
116
Difference in outcomes with and without a risk
factor
– Indicates likelihood of developing disease in
exposed group relative to unexposed group
factor
– Indicates likelihood of developing disease in
exposed group relative to unexposed group
relative risk
117
relative risk equation
118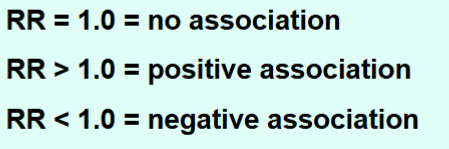
what does relative risk tell you
119
what type of study would have a table layout like this?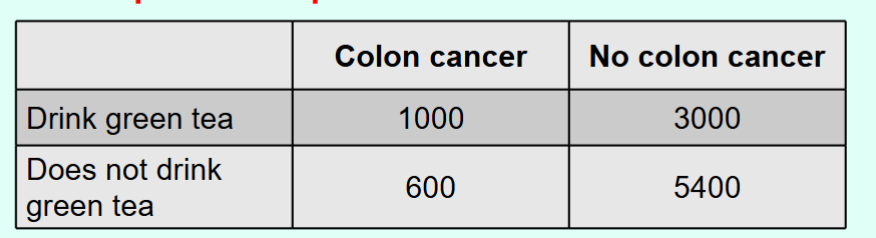
cohort study
120
absolute risk equation cohort study
Absolute Risk (AR) = (Number of events in a group) / (Total number of individuals in that group)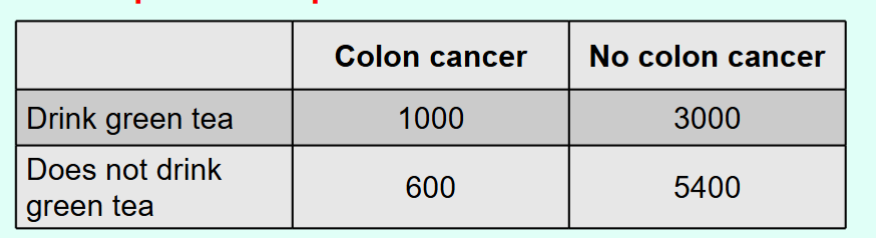
121
Risk difference
• Portion of incidence in exposed group that is due to
exposure
– Incidence of disease in exposed group that would be
eliminated if exposure were eliminated
• Portion of incidence in exposed group that is due to
exposure
– Incidence of disease in exposed group that would be
eliminated if exposure were eliminated
attributable risk (AR)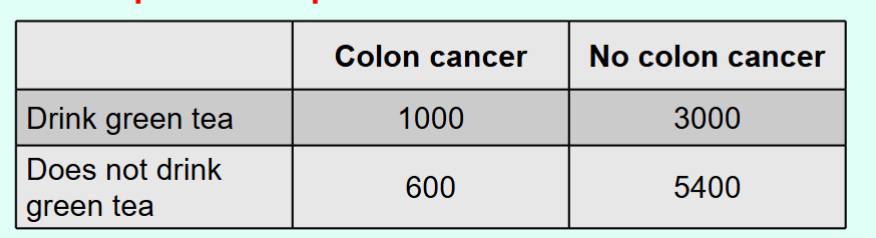
122
attriutable risk equation
risk exposed- risk unexposed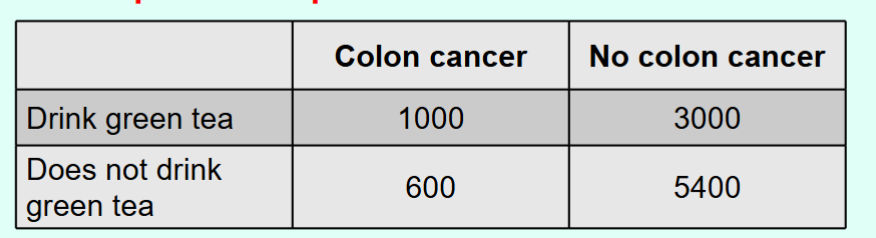
123
absolute risk reduction eqyation
ARR = risk (unexposed) – risk (exposed)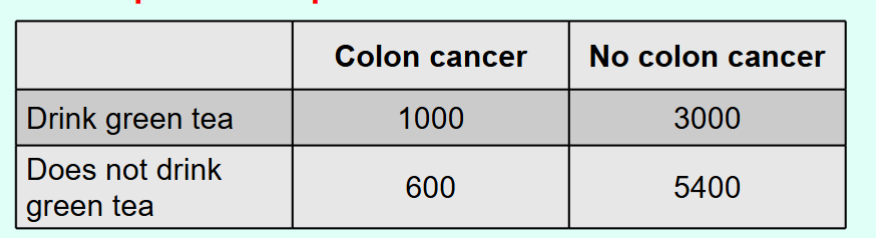
124
Odds ratio equation
125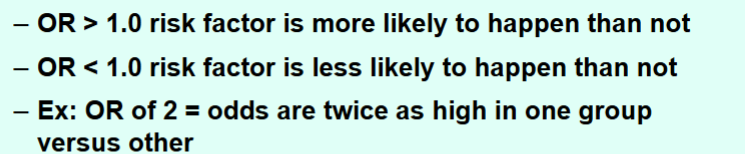
Odds ratio outcomes
126
phases of clinical trial (x4)
-Phase I: small number of healthy volunteers
• Looks at safety and toxicity
– Phase II: small # of pts with disease
• Looks at treatment efficacy, dosing, side effects
– Phase III: Randomized Control Trial (next)
• Large # of pts with disease randomized into treatment or
control (placebo) group
• Compares new treatment to existing standard care
– Phase IV: Surveillance after approval and use
• Monitors long-term side effects
• Looks at safety and toxicity
– Phase II: small # of pts with disease
• Looks at treatment efficacy, dosing, side effects
– Phase III: Randomized Control Trial (next)
• Large # of pts with disease randomized into treatment or
control (placebo) group
• Compares new treatment to existing standard care
– Phase IV: Surveillance after approval and use
• Monitors long-term side effects
127
quantitative, formal, epidemiological study design used to
systematically assess previous research studies to derive
conclusions about that body of research
systematically assess previous research studies to derive
conclusions about that body of research
meta analysis
128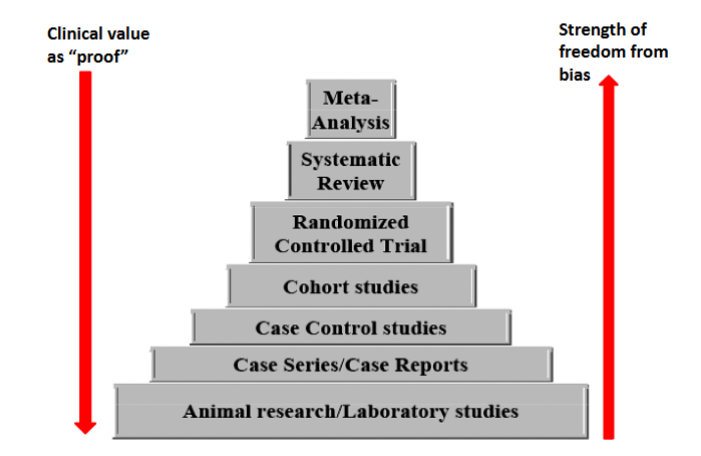
Image occlusion: name the hidden labels
129
Image occlusion: name the hidden labels
130
advantages of meta analysis
To improve precision. Many studies are too small to provide
convincing evidence about intervention effects in isolation.
Estimation is usually improved when it is based on more
information.
• To answer questions not posed by the individual studies.
Primary studies often involve a specific type of participant and
explicitly defined interventions. A selection of studies in which
these characteristics differ can allow investigation of the
consistency of effect across a wider range of populations and
interventions. It may also, if relevant, allow reasons for
differences in effect estimates to be investigated.
• To settle controversies arising from apparently conflicting
studies or to generate new hypotheses. Statistical synthesis of
findings allows the degree of conflict to be formally assessed,
and reasons for different results to be explored and quantified.
convincing evidence about intervention effects in isolation.
Estimation is usually improved when it is based on more
information.
• To answer questions not posed by the individual studies.
Primary studies often involve a specific type of participant and
explicitly defined interventions. A selection of studies in which
these characteristics differ can allow investigation of the
consistency of effect across a wider range of populations and
interventions. It may also, if relevant, allow reasons for
differences in effect estimates to be investigated.
• To settle controversies arising from apparently conflicting
studies or to generate new hypotheses. Statistical synthesis of
findings allows the degree of conflict to be formally assessed,
and reasons for different results to be explored and quantified.
131
usual presentation of meta analysis data
forest plot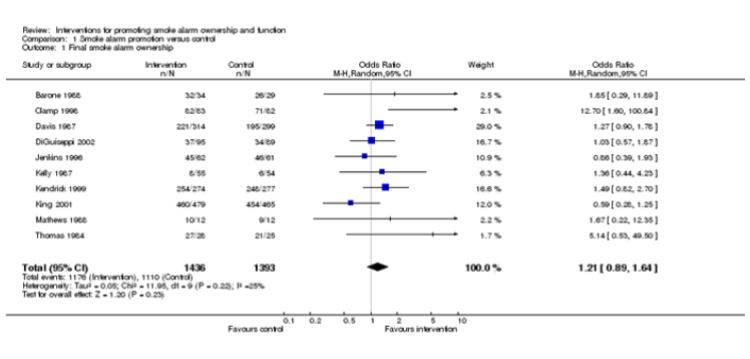
132
Variation between studies
heterogeneity
133
variabiliuty in the participants, interventionsm and outcomes studied
clinical diversity (clinical heterogeneity)
134
variability in study desigm, outcoe measurement tools and risk of bias
methodological diversity
135
variability in the intervention effects being evaluated in the different studies
statistical heterogeneity
136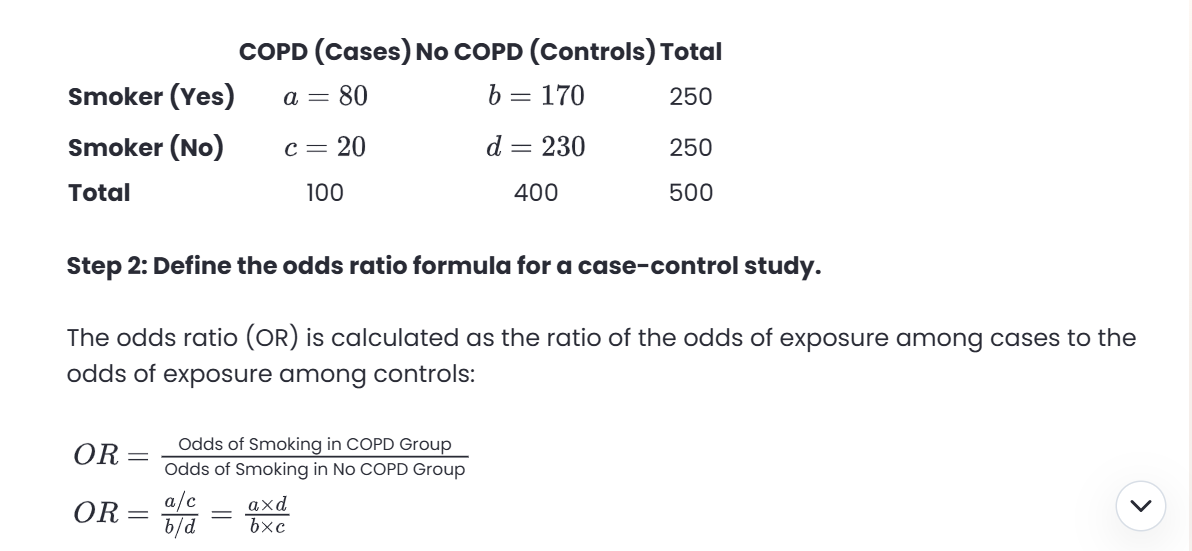
how do you calculate an odds ratio?
137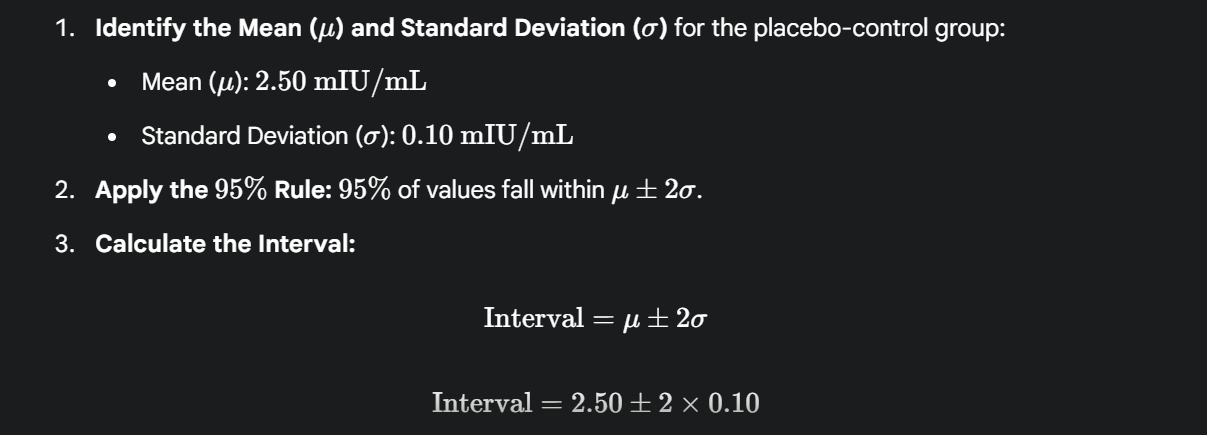
how to calc CI
138
what are the different confidence intervals
139
case control studies are (prospectiveestrospective) and cohort studies are (prospectiveetrospective)
retrospective; prospective